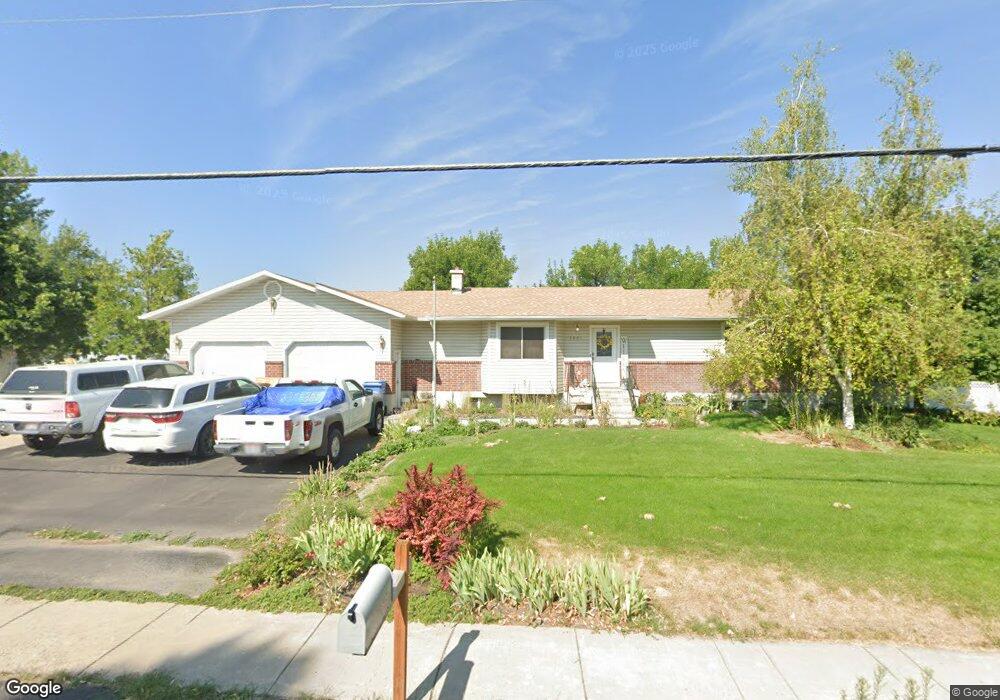
3021 S 800 W Nibley, UT 84321
Estimated Value: $456,000 - $601,000
5
Beds
2
Baths
2,071
Sq Ft
$261/Sq Ft
Est. Value
About This Home
This home is located at 3021 S 800 W, Nibley, UT 84321 and is currently estimated at $540,690, approximately $261 per square foot. 3021 S 800 W is a home located in Cache County with nearby schools including Heritage School, South Cache Middle School, and Spring Creek Middle School.
Ownership History
Date
Name
Owned For
Owner Type
Purchase Details
Closed on
Feb 25, 2020
Sold by
Duncan Jeremiah Seitzinger
Bought by
Duncan Jeremiah S and Jeremiah S Duncan Revcable Tru
Current Estimated Value
Purchase Details
Closed on
Mar 31, 2017
Sold by
Funk Alice Seitzinger
Bought by
Duncan Jeremiah Seitzinger
Purchase Details
Closed on
Jun 29, 2016
Sold by
Funk Alice
Bought by
Funk Alice Seitzinger
Purchase Details
Closed on
Jun 7, 2016
Sold by
Larsen Norman and Larsen Charlotte
Bought by
Funk Alice
Create a Home Valuation Report for This Property
The Home Valuation Report is an in-depth analysis detailing your home's value as well as a comparison with similar homes in the area
Home Values in the Area
Average Home Value in this Area
Purchase History
| Date | Buyer | Sale Price | Title Company |
|---|---|---|---|
| Duncan Jeremiah S | -- | None Available | |
| Duncan Jeremiah Seitzinger | -- | Northern Title Company | |
| Funk Alice Seitzinger | -- | Accommodation | |
| Funk Alice | -- | Advance Title |
Source: Public Records
Tax History Compared to Growth
Tax History
| Year | Tax Paid | Tax Assessment Tax Assessment Total Assessment is a certain percentage of the fair market value that is determined by local assessors to be the total taxable value of land and additions on the property. | Land | Improvement |
|---|---|---|---|---|
| 2025 | $2,401 | $318,250 | $0 | $0 |
| 2024 | $256 | $318,805 | $0 | $0 |
| 2023 | $2,423 | $282,350 | $0 | $0 |
| 2022 | $2,522 | $282,350 | $0 | $0 |
| 2021 | $2,360 | $410,400 | $67,200 | $343,200 |
| 2020 | $2,134 | $353,200 | $67,200 | $286,000 |
| 2019 | $2,218 | $350,022 | $67,200 | $282,822 |
| 2018 | $1,854 | $285,520 | $45,840 | $239,680 |
| 2017 | $1,752 | $142,910 | $0 | $0 |
| 2016 | $1,772 | $98,855 | $0 | $0 |
| 2015 | $1,218 | $98,855 | $0 | $0 |
| 2014 | $1,099 | $91,280 | $0 | $0 |
| 2013 | -- | $93,565 | $0 | $0 |
Source: Public Records
Map
Nearby Homes
- 907 W 2980 S
- 3074 S 800 W
- 2938 S 600 W
- 3369 1010 W
- 3372 1010 W
- 2814 S 1150 W
- 2680 S 600 W
- 2616 S 900 W
- 1008 W 3410 S
- 1004 3410 S
- 2615 S 600 W
- 400 W 3085 S
- 3262 S 470 W
- 374 Ropelato Dr
- 268 W 3400 S Unit 5
- Lyndhurst Plan at Ridgeline Park - Nibley (Active Adult)
- Blackberry Plan at Ridgeline Park - Nibley
- Auburn Plan at Ridgeline Park - Nibley
- Auburn Plan at Ridgeline Park - Nibley (Active Adult)
- Hickory Plan at Ridgeline Park - Nibley