Estimated Value: $395,000 - $414,000
4
Beds
1
Bath
890
Sq Ft
$456/Sq Ft
Est. Value
About This Home
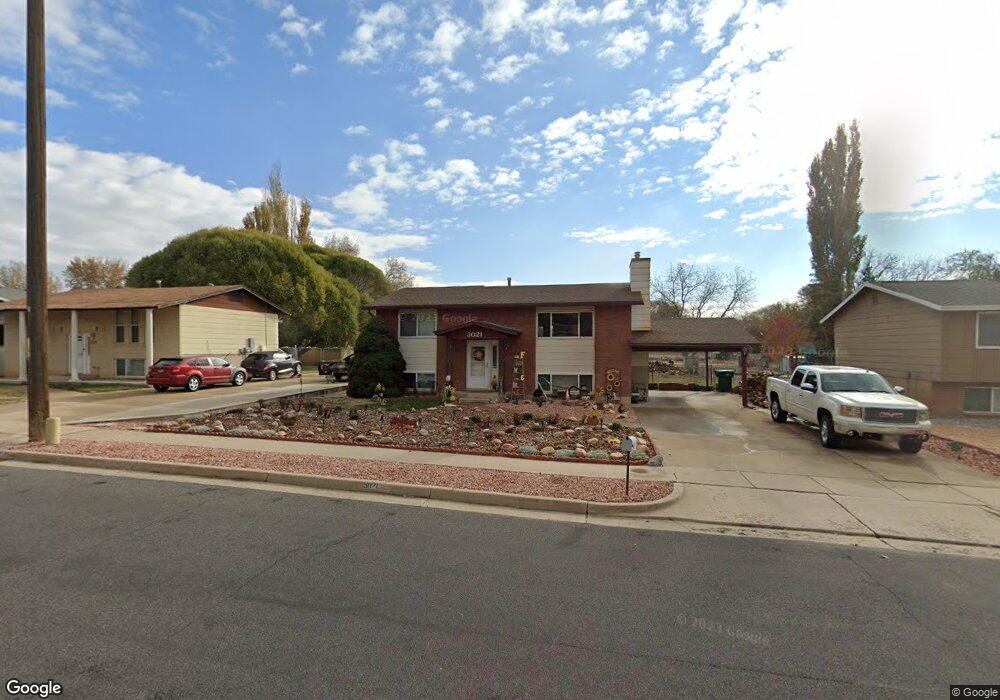
This home is located at 3021 W 5700 S, Roy, UT 84067 and is currently estimated at $405,592, approximately $455 per square foot. 3021 W 5700 S is a home located in Weber County with nearby schools including Roy Elementary School, Roy Junior High School, and Roy High School.
Ownership History
Date
Name
Owned For
Owner Type
Purchase Details
Closed on
Aug 22, 2024
Sold by
Fowers Kimber J
Bought by
Kimber And Sherie Fowers Living Trust and Fowers
Current Estimated Value
Purchase Details
Closed on
Jun 21, 2024
Sold by
Fowers Kim J and Fowers Sherie D
Bought by
Kimber And Sherie Fowers Living Trust and Fowers
Purchase Details
Closed on
Nov 24, 1998
Sold by
Fowers Kim J and Fowers Kimber J
Bought by
Fowers Kim J
Home Financials for this Owner
Home Financials are based on the most recent Mortgage that was taken out on this home.
Original Mortgage
$98,000
Interest Rate
6.84%
Mortgage Type
Purchase Money Mortgage
Purchase Details
Closed on
Aug 6, 1997
Sold by
Jackson Mark A
Bought by
Howard Lucille H
Create a Home Valuation Report for This Property
The Home Valuation Report is an in-depth analysis detailing your home's value as well as a comparison with similar homes in the area
Home Values in the Area
Average Home Value in this Area
Purchase History
| Date | Buyer | Sale Price | Title Company |
|---|---|---|---|
| Kimber And Sherie Fowers Living Trust | -- | None Listed On Document | |
| Kimber And Sherie Fowers Living Trust | -- | None Listed On Document | |
| Fowers Kim J | -- | Brighton Title | |
| Howard Lucille H | -- | Founders Title |
Source: Public Records
Mortgage History
| Date | Status | Borrower | Loan Amount |
|---|---|---|---|
| Previous Owner | Fowers Kim J | $98,000 |
Source: Public Records
Tax History Compared to Growth
Tax History
| Year | Tax Paid | Tax Assessment Tax Assessment Total Assessment is a certain percentage of the fair market value that is determined by local assessors to be the total taxable value of land and additions on the property. | Land | Improvement |
|---|---|---|---|---|
| 2025 | $2,421 | $379,115 | $128,411 | $250,704 |
| 2024 | $2,365 | $205,149 | $70,626 | $134,523 |
| 2023 | $2,218 | $191,950 | $67,930 | $124,020 |
| 2022 | $2,420 | $217,800 | $60,541 | $157,259 |
| 2021 | $1,992 | $294,000 | $78,726 | $215,274 |
| 2020 | $1,867 | $253,000 | $78,726 | $174,274 |
| 2019 | $1,748 | $222,000 | $47,990 | $174,010 |
| 2018 | $1,600 | $190,000 | $46,041 | $143,959 |
| 2017 | $1,482 | $164,000 | $46,041 | $117,959 |
| 2016 | $1,412 | $83,856 | $21,944 | $61,912 |
| 2015 | $1,247 | $74,970 | $21,944 | $53,026 |
| 2014 | $1,257 | $74,970 | $21,944 | $53,026 |
Source: Public Records
Map
Nearby Homes
- 2907 W 5775 S
- 3166 W 5625 S
- 3176 W 5625 S
- 3186 W 5625 S
- 3198 W 5825 S
- 5538 S 3150 W
- 5998 S 3100 W
- 5791 S 3260 W
- 2829 W 5925 S
- 3009 W 6000 S
- 2786 W 5550 S Unit C11
- 5432 S 3150 W
- 2778 W 5550 S Unit 28
- 2672 W 5750 S
- 2646 W 5625 S Unit M-2646
- 5321 S 3100 W
- 2571 W 5725 S
- 2587 W 5750 S
- 5859 S 3500 W
- 2537 N 1220 W