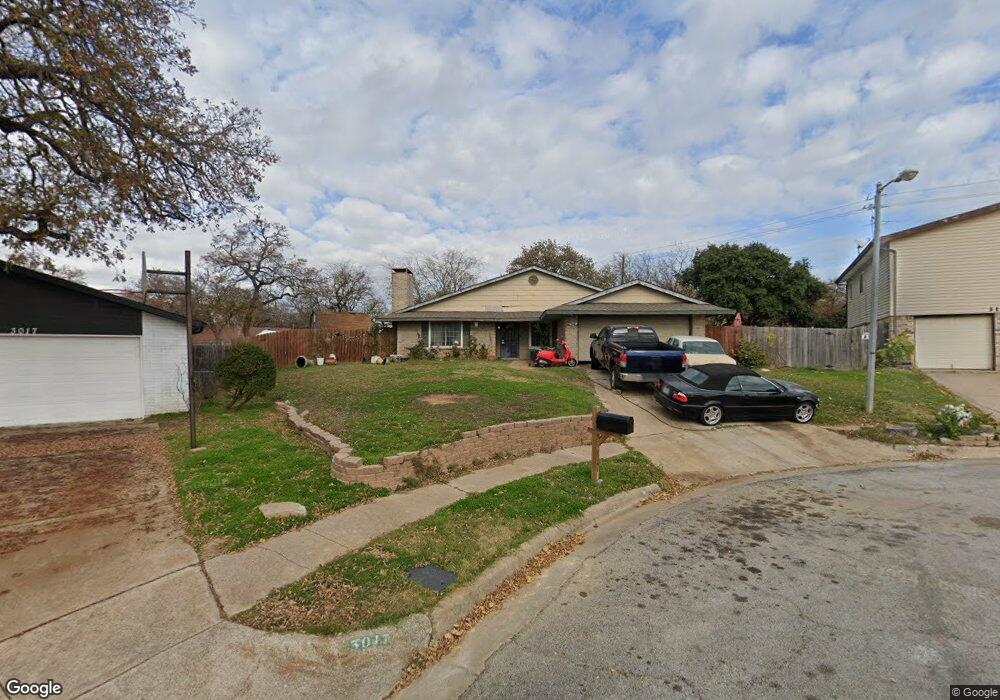
3021 Wayfarer Rd Bedford, TX 76021
Estimated Value: $353,000 - $395,587
4
Beds
2
Baths
2,071
Sq Ft
$183/Sq Ft
Est. Value
About This Home
This home is located at 3021 Wayfarer Rd, Bedford, TX 76021 and is currently estimated at $378,397, approximately $182 per square foot. 3021 Wayfarer Rd is a home located in Tarrant County with nearby schools including Meadow Creek Elementary School, Harwood Junior High School, and Trinity High School.
Ownership History
Date
Name
Owned For
Owner Type
Purchase Details
Closed on
Nov 30, 1998
Sold by
Murphy John Bernard and Murphy Jana Ives
Bought by
Chamberlain Donald T and Chamberlain Janet S
Current Estimated Value
Home Financials for this Owner
Home Financials are based on the most recent Mortgage that was taken out on this home.
Original Mortgage
$111,625
Outstanding Balance
$25,553
Interest Rate
6.87%
Estimated Equity
$352,844
Purchase Details
Closed on
Jan 30, 1996
Sold by
Va
Bought by
Murphy John Bernard and Murphy Jana Ives
Home Financials for this Owner
Home Financials are based on the most recent Mortgage that was taken out on this home.
Original Mortgage
$110,850
Interest Rate
7%
Mortgage Type
Seller Take Back
Purchase Details
Closed on
Jul 18, 1995
Sold by
Resource Bancshares Mtg Group Inc
Bought by
Va
Purchase Details
Closed on
Jul 4, 1995
Sold by
Billington Jerry Vaughn and Billington Carolyn S
Bought by
Resource Bancshares Mtg Group Inc
Create a Home Valuation Report for This Property
The Home Valuation Report is an in-depth analysis detailing your home's value as well as a comparison with similar homes in the area
Home Values in the Area
Average Home Value in this Area
Purchase History
| Date | Buyer | Sale Price | Title Company |
|---|---|---|---|
| Chamberlain Donald T | -- | First American Title Co | |
| Murphy John Bernard | -- | Safeco Land Title Co | |
| Va | -- | -- | |
| Resource Bancshares Mtg Group Inc | $89,275 | -- |
Source: Public Records
Mortgage History
| Date | Status | Borrower | Loan Amount |
|---|---|---|---|
| Open | Chamberlain Donald T | $111,625 | |
| Previous Owner | Murphy John Bernard | $110,850 |
Source: Public Records
Tax History Compared to Growth
Tax History
| Year | Tax Paid | Tax Assessment Tax Assessment Total Assessment is a certain percentage of the fair market value that is determined by local assessors to be the total taxable value of land and additions on the property. | Land | Improvement |
|---|---|---|---|---|
| 2025 | $5,683 | $306,146 | $75,000 | $231,146 |
| 2024 | $5,683 | $360,172 | $75,000 | $285,172 |
| 2023 | $6,243 | $355,000 | $45,000 | $310,000 |
| 2022 | $6,463 | $316,000 | $45,000 | $271,000 |
| 2021 | $6,337 | $269,000 | $44,019 | $224,981 |
| 2020 | $6,395 | $275,000 | $45,000 | $230,000 |
| 2019 | $5,940 | $275,000 | $45,000 | $230,000 |
| 2018 | $5,018 | $222,277 | $45,000 | $177,277 |
| 2017 | $4,888 | $249,701 | $30,000 | $219,701 |
| 2016 | $4,444 | $190,000 | $27,060 | $162,940 |
| 2015 | $3,919 | $167,000 | $18,000 | $149,000 |
| 2014 | $3,919 | $181,700 | $18,000 | $163,700 |
Source: Public Records
Map
Nearby Homes
- 3205 Princess St
- 3001 Glenwood Ct
- 3104 Emerald St
- 3100 Emerald St
- 2709 Willow Bend
- 3209 Misty Ct
- 3024 Pecan Cir
- 3213 Vintage Way
- 3024 Highgate Ln
- 3405 Scenic Hills Dr
- 2616 Greenwood Ct
- 2600 Willow Bend
- 3428 Pembroke Place
- 3017 Bluebonnet Ln
- 2700 Mimosa Ct
- 2922 Beachtree Ln
- 3112 Hazlewood Ct
- 2609 Woodson Dr
- 2521 Sanders Ct
- 3013 Bent Tree Ln
- 3017 Wayfarer Rd
- 3128 Wayfarer Rd
- 3012 Chaucer Ln
- 3016 Chaucer Ln
- 3013 Wayfarer Rd
- 3008 Chaucer Ln
- 3124 Wayfarer Rd
- 3004 Chaucer Ln
- 3125 Wayfarer Rd
- 3009 Wayfarer Rd
- 3101 Teakwood Dr
- 3100 Joseph Ct
- 3120 Wayfarer Rd
- 3000 Chaucer Ln
- 3121 Wayfarer Rd
- 3116 Willow Bend
- 3116 Willow Bend
- 3100 Teakwood Dr
- 3105 Teakwood Dr
- 3116 Wayfarer Rd