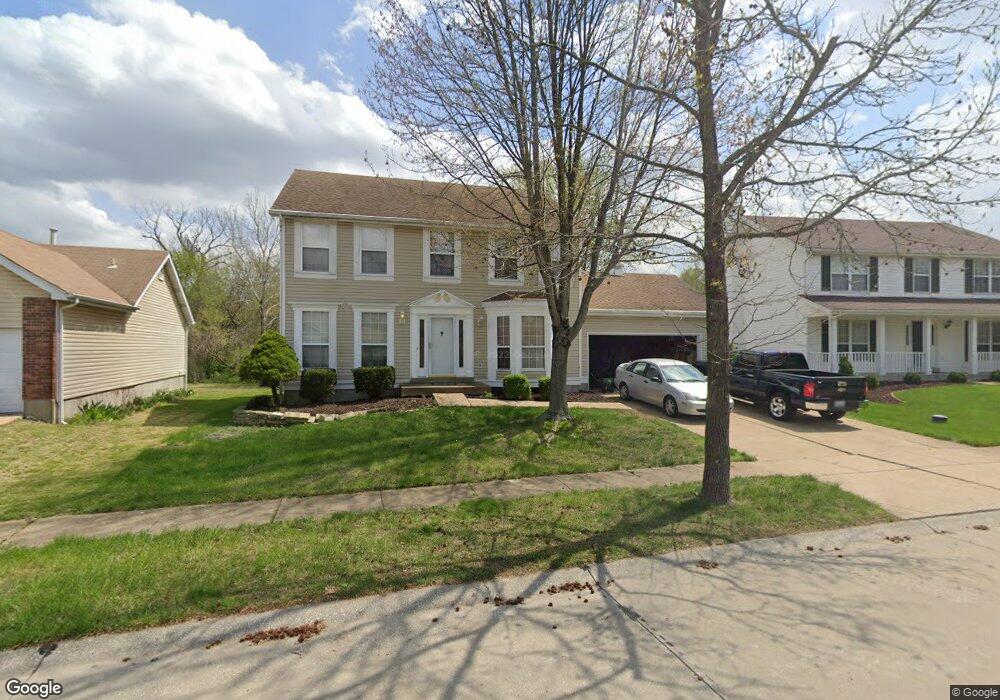
3021 Willow Creek Estates Dr Florissant, MO 63031
Estimated Value: $288,000 - $325,000
4
Beds
4
Baths
2,302
Sq Ft
$136/Sq Ft
Est. Value
About This Home
This home is located at 3021 Willow Creek Estates Dr, Florissant, MO 63031 and is currently estimated at $313,257, approximately $136 per square foot. 3021 Willow Creek Estates Dr is a home located in St. Louis County with nearby schools including Jana Elementary School, North Middle School, and Hazelwood Central High School.
Ownership History
Date
Name
Owned For
Owner Type
Purchase Details
Closed on
Mar 24, 2008
Sold by
Wells Fargo Bank Na
Bought by
Wilhite Raymond
Current Estimated Value
Home Financials for this Owner
Home Financials are based on the most recent Mortgage that was taken out on this home.
Original Mortgage
$162,450
Outstanding Balance
$102,608
Interest Rate
6%
Mortgage Type
FHA
Estimated Equity
$210,649
Purchase Details
Closed on
Nov 29, 2006
Sold by
Sanders Frank and Sanders Ronyel
Bought by
Carter David
Home Financials for this Owner
Home Financials are based on the most recent Mortgage that was taken out on this home.
Original Mortgage
$43,200
Interest Rate
5.91%
Mortgage Type
Stand Alone Second
Purchase Details
Closed on
Jun 4, 2004
Sold by
Dwyer John B and Dwyer Carol J
Bought by
Sanders Ronyel
Home Financials for this Owner
Home Financials are based on the most recent Mortgage that was taken out on this home.
Original Mortgage
$197,246
Interest Rate
5.37%
Mortgage Type
VA
Create a Home Valuation Report for This Property
The Home Valuation Report is an in-depth analysis detailing your home's value as well as a comparison with similar homes in the area
Home Values in the Area
Average Home Value in this Area
Purchase History
| Date | Buyer | Sale Price | Title Company |
|---|---|---|---|
| Wilhite Raymond | $165,000 | None Available | |
| Carter David | $215,999 | Davis Title & Abstract Co | |
| Sanders Ronyel | $193,000 | Capital Title |
Source: Public Records
Mortgage History
| Date | Status | Borrower | Loan Amount |
|---|---|---|---|
| Open | Wilhite Raymond | $162,450 | |
| Previous Owner | Carter David | $43,200 | |
| Previous Owner | Carter David | $172,799 | |
| Previous Owner | Sanders Ronyel | $197,246 |
Source: Public Records
Tax History Compared to Growth
Tax History
| Year | Tax Paid | Tax Assessment Tax Assessment Total Assessment is a certain percentage of the fair market value that is determined by local assessors to be the total taxable value of land and additions on the property. | Land | Improvement |
|---|---|---|---|---|
| 2025 | $4,453 | $55,690 | $5,260 | $50,430 |
| 2024 | $4,453 | $50,220 | $2,700 | $47,520 |
| 2023 | $4,447 | $50,220 | $2,700 | $47,520 |
| 2022 | $3,918 | $39,440 | $7,520 | $31,920 |
| 2021 | $3,816 | $39,440 | $7,520 | $31,920 |
| 2020 | $3,806 | $36,840 | $3,910 | $32,930 |
| 2019 | $3,748 | $36,840 | $3,910 | $32,930 |
| 2018 | $3,430 | $30,990 | $2,320 | $28,670 |
| 2017 | $3,426 | $30,990 | $2,320 | $28,670 |
| 2016 | $3,144 | $28,030 | $3,040 | $24,990 |
| 2015 | $3,077 | $28,030 | $3,040 | $24,990 |
| 2014 | $2,601 | $24,380 | $4,160 | $20,220 |
Source: Public Records
Map
Nearby Homes
- 6 Willow Creek Estates Ct
- 549 Rancho Ln
- 3370 Suncrest Dr
- 2932 Sherwood Dr
- 733 Mediterranean Dr
- 2750 Robert Dr
- 519 Greenway Chase Ct
- 2755 Benne Dr
- 644 Shadow Rock Dr
- 425 Jana Dr
- 500 Jana Dr
- 605 Sherwood Dr
- 2036 Retford Dr
- 490 Lula Dr
- 1993 Greenheath Dr
- 15467 Jost Main St
- 2525 Wedgwood Dr W
- 2980 Wellington Dr
- 675 Lawnview Dr
- 1114 Ransome Ct
- 3017 Willow Creek Estates Dr
- 3025 Willow Creek Estates Dr
- 3029 Willow Creek Estates Dr
- 3022 Willow Creek Estates Dr
- 3018 Willow Creek Estates Dr
- 3028 Willow Creek Estates Dr
- 3009 Willow Creek Estates Dr
- 3012 Willow Creek Estates Dr
- 3033 Willow Creek Estates Dr
- 3008 Willow Creek Estates Dr
- 2908 Rexford Creek Ct
- 3005 Willow Creek Estates Dr
- 3044 Willow Creek Estates Dr
- 2914 Rexford Creek Ct
- 3037 Willow Creek Estates Dr
- 2902 Rexford Creek Ct
- 3001 Willow Creek Estates Dr
- 3050 Willow Creek Estates Dr
- 2920 Rexford Creek Ct
- 3002 Willow Creek Estates Dr