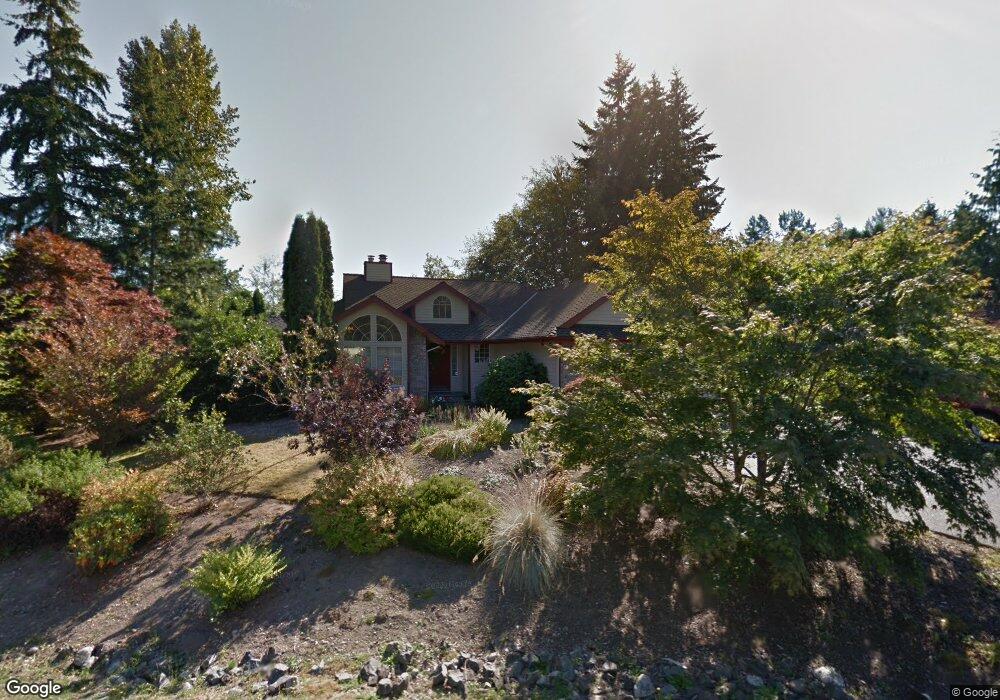
3022 184th Place SE Bothell, WA 98012
North Creek NeighborhoodEstimated Value: $1,192,000 - $1,454,000
4
Beds
3
Baths
2,013
Sq Ft
$661/Sq Ft
Est. Value
About This Home
This home is located at 3022 184th Place SE, Bothell, WA 98012 and is currently estimated at $1,331,305, approximately $661 per square foot. 3022 184th Place SE is a home located in Snohomish County with nearby schools including Canyon Creek Elementary School, Skyview Middle School, and North Creek High School.
Ownership History
Date
Name
Owned For
Owner Type
Purchase Details
Closed on
Jul 9, 2019
Sold by
Harris Paul
Bought by
Thoren Harris Paul and Thoren Harris Geraldine
Current Estimated Value
Purchase Details
Closed on
Dec 14, 1998
Sold by
Thoren Geraldine S
Bought by
Harris Paul C
Purchase Details
Closed on
Jul 25, 1997
Sold by
Morasci Michael A and Morasci Peggy D
Bought by
Harris Paul C and Thoren Geraldine S
Home Financials for this Owner
Home Financials are based on the most recent Mortgage that was taken out on this home.
Original Mortgage
$214,600
Interest Rate
7.58%
Purchase Details
Closed on
Oct 17, 1994
Sold by
Spence C G and Spence Karen J
Bought by
Morasci Michael A and Morasci Peggy D
Home Financials for this Owner
Home Financials are based on the most recent Mortgage that was taken out on this home.
Original Mortgage
$130,000
Interest Rate
8.7%
Create a Home Valuation Report for This Property
The Home Valuation Report is an in-depth analysis detailing your home's value as well as a comparison with similar homes in the area
Home Values in the Area
Average Home Value in this Area
Purchase History
We collect this data history from publicly available records. To have your information removed, we recommend requesting removal directly through your county’s website.
| Date | Buyer | Sale Price | Title Company |
|---|---|---|---|
| Thoren Harris Paul | -- | None Available | |
| Harris Paul C | $166,571 | -- | |
| Harris Paul C | $314,000 | -- | |
| Morasci Michael A | $275,000 | Transamerica Title Ins Co |
Source: Public Records
Mortgage History
We collect this data history from publicly available records. To have your information removed, we recommend requesting removal directly through your county’s website.
| Date | Status | Borrower | Loan Amount |
|---|---|---|---|
| Previous Owner | Harris Paul C | $214,600 | |
| Previous Owner | Morasci Michael A | $130,000 |
Source: Public Records
Tax History
| Year | Tax Paid | Tax Assessment Tax Assessment Total Assessment is a certain percentage of the fair market value that is determined by local assessors to be the total taxable value of land and additions on the property. | Land | Improvement |
|---|---|---|---|---|
| 2026 | $11,139 | $1,312,600 | $751,900 | $560,700 |
| 2025 | $9,972 | $1,245,900 | $700,400 | $545,500 |
| 2024 | $9,972 | $1,115,000 | $612,900 | $502,100 |
| 2023 | $10,941 | $1,365,400 | $841,500 | $523,900 |
| 2022 | $10,252 | $1,017,800 | $576,300 | $441,500 |
| 2020 | $8,867 | $830,000 | $445,600 | $384,400 |
| 2019 | $7,724 | $730,900 | $356,300 | $374,600 |
| 2018 | $7,364 | $649,000 | $313,500 | $335,500 |
| 2017 | $6,439 | $577,500 | $266,000 | $311,500 |
| 2016 | $6,225 | $545,000 | $242,300 | $302,700 |
| 2015 | $6,013 | $500,000 | $228,000 | $272,000 |
| 2013 | $5,029 | $371,400 | $153,000 | $218,400 |
Source: Public Records
Map
Nearby Homes
- 121 171st Place SW Unit B
- 18501 28th Ave SE
- 18102 31st Ave SE
- 3514 184th Place SE
- 3123 189th Place SE
- 18801 34th Ave SE
- 2531 187th Place SE
- 2613 189th St SE
- 18725 35th Dr SE
- 18213 36th Ave SE Unit 68
- 19011 27th Dr SE
- 3205 179th Place SE
- 17903 33rd Ave SE
- 2416 182nd Place SE
- 19015 25th Dr SE
- 2623 179th St SE Unit 14
- 17905 35th Ave SE Unit B4
- 19307 31st Dr SE
- 3228 177th Place SE
- 3123 194th St SE
- 3014 184th Place SE
- 3027 184th Place SE
- 2932 184th Place SE
- 3019 184th Place SE
- 3003 184th Place SE
- 18505 31st Ave SE
- 2926 184th Place SE
- 3030 185th Place SE
- 3024 185th Place SE
- 3022 183rd Place SE
- 3018 183rd Place SE
- 3024 183rd Place SE
- 3026 183rd Place SE
- 3014 183rd Place SE
- 3028 183rd Place SE
- 18518 32nd Ave SE
- 3010 183rd Place SE
- 3030 183rd Place SE
- 18515 32nd Ave SE
- 18604 29th Ave SE
Your Personal Tour Guide
Ask me questions while you tour the home.