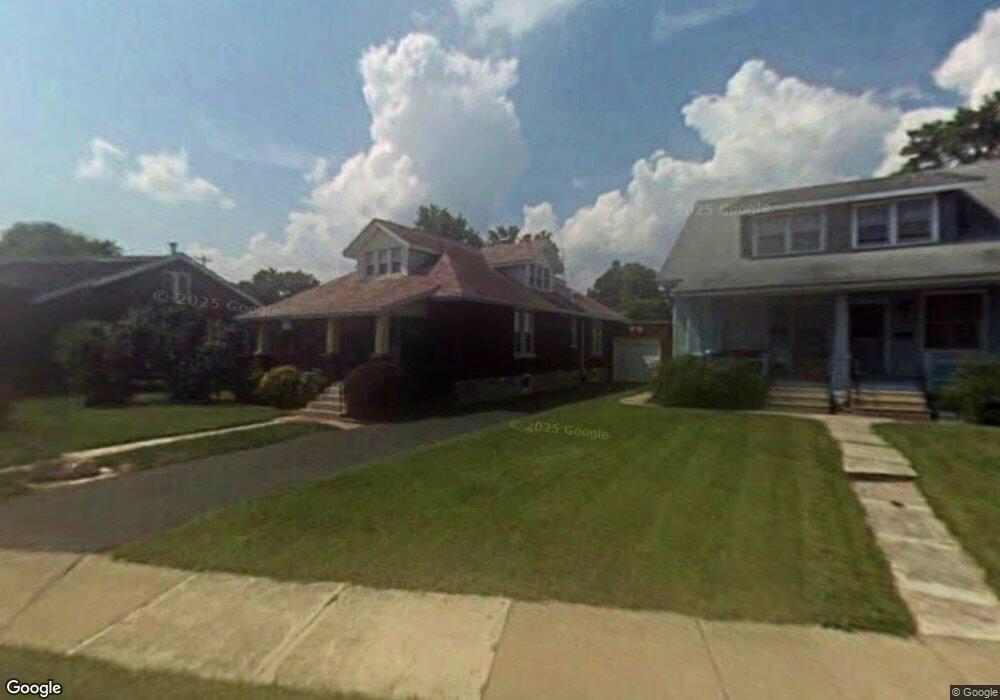
3022 W Main St Belleville, IL 62226
Estimated Value: $118,000 - $170,731
3
Beds
2
Baths
1,423
Sq Ft
$101/Sq Ft
Est. Value
About This Home
This home is located at 3022 W Main St, Belleville, IL 62226 and is currently estimated at $144,433, approximately $101 per square foot. 3022 W Main St is a home located in St. Clair County with nearby schools including Union Elementary School, West Jr High School, and Governor French Academy.
Ownership History
Date
Name
Owned For
Owner Type
Purchase Details
Closed on
Sep 28, 2011
Sold by
Schmidt Roger C and Schmidt Trudy A
Bought by
Hallinan Terance and Hallinan Sandra J
Current Estimated Value
Home Financials for this Owner
Home Financials are based on the most recent Mortgage that was taken out on this home.
Original Mortgage
$70,943
Outstanding Balance
$48,479
Interest Rate
4.14%
Mortgage Type
VA
Estimated Equity
$95,954
Create a Home Valuation Report for This Property
The Home Valuation Report is an in-depth analysis detailing your home's value as well as a comparison with similar homes in the area
Home Values in the Area
Average Home Value in this Area
Purchase History
| Date | Buyer | Sale Price | Title Company |
|---|---|---|---|
| Hallinan Terance | $69,500 | Benchmark Title Company |
Source: Public Records
Mortgage History
| Date | Status | Borrower | Loan Amount |
|---|---|---|---|
| Open | Hallinan Terance | $70,943 |
Source: Public Records
Tax History Compared to Growth
Tax History
| Year | Tax Paid | Tax Assessment Tax Assessment Total Assessment is a certain percentage of the fair market value that is determined by local assessors to be the total taxable value of land and additions on the property. | Land | Improvement |
|---|---|---|---|---|
| 2024 | $3,834 | $49,594 | $4,097 | $45,497 |
| 2023 | $3,503 | $43,318 | $4,016 | $39,302 |
| 2022 | $3,158 | $38,997 | $3,615 | $35,382 |
| 2021 | $2,996 | $36,052 | $3,342 | $32,710 |
| 2020 | $2,887 | $34,093 | $3,161 | $30,932 |
| 2019 | $2,945 | $34,426 | $3,165 | $31,261 |
| 2018 | $2,866 | $33,682 | $3,097 | $30,585 |
| 2017 | $2,845 | $33,445 | $3,075 | $30,370 |
| 2016 | $2,804 | $33,377 | $3,010 | $30,367 |
| 2014 | $2,717 | $35,381 | $4,630 | $30,751 |
| 2013 | $2,405 | $35,887 | $4,696 | $31,191 |
Source: Public Records
Map
Nearby Homes