3023 Lynde St Oakland, CA 94601
Patten NeighborhoodEstimated Value: $460,000 - $661,709
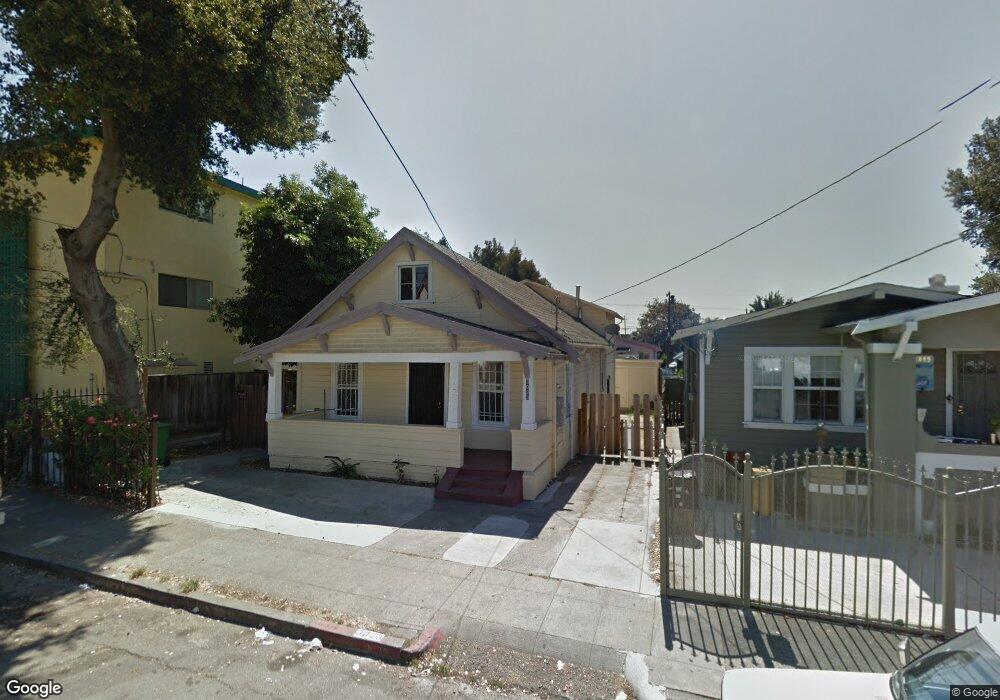
About This Home
This home is located at 3023 Lynde St, Oakland, CA 94601 and is currently estimated at $571,677, approximately $393 per square foot. 3023 Lynde St is a home located in Alameda County with nearby schools including Manzanita Seed Elementary School, Manzanita Community School, and Bret Harte Middle School.
Ownership History
We collect this data history from publicly available records. To have your information removed, we recommend requesting removal directly through your county’s website.
Purchase Details
Home Financials for this Owner
Home Financials are based on the most recent Mortgage that was taken out on this home.Purchase Details
Home Financials for this Owner
Home Financials are based on the most recent Mortgage that was taken out on this home.Purchase Details
Home Financials for this Owner
Home Financials are based on the most recent Mortgage that was taken out on this home.Purchase Details
Home Financials for this Owner
Home Financials are based on the most recent Mortgage that was taken out on this home.Purchase Details
Home Financials for this Owner
Home Financials are based on the most recent Mortgage that was taken out on this home.Purchase Details
Purchase Details
Home Financials for this Owner
Home Financials are based on the most recent Mortgage that was taken out on this home.Purchase Details
Home Financials for this Owner
Home Financials are based on the most recent Mortgage that was taken out on this home.Purchase Details
Home Values in the Area
Average Home Value in this Area
Purchase History
We collect this data history from publicly available records. To have your information removed, we recommend requesting removal directly through your county’s website.
| Date | Buyer | Sale Price | Title Company |
|---|---|---|---|
| $1,584,272 | Servicelink | ||
| $425,000 | First American Title Company | ||
| -- | Chicago Title Company | ||
| -- | Chicago Title Company | ||
| $188,000 | Chicago Title Company | ||
| $283,178 | None Available | ||
| -- | Ticor Title Co Of Ca | ||
| -- | Alliance Title Company | ||
| $353,000 | Alliance Title Company | ||
| -- | Northwestern Title |
Mortgage History
We collect this data history from publicly available records. To have your information removed, we recommend requesting removal directly through your county’s website.
| Date | Status | Borrower | Loan Amount |
|---|---|---|---|
| Previous Owner | $310,000 | ||
| Previous Owner | $310,000 | ||
| Previous Owner | $318,750 | ||
| Previous Owner | $235,000 | ||
| Previous Owner | $150,400 | ||
| Previous Owner | $522,000 | ||
| Previous Owner | $432,000 | ||
| Previous Owner | $126,070 | ||
| Previous Owner | $282,400 |
Tax History
We collect this data history from publicly available records. To have your information removed, we recommend requesting removal directly through your county’s website.
| Year | Tax Paid | Tax Assessment Tax Assessment Total Assessment is a certain percentage of the fair market value that is determined by local assessors to be the total taxable value of land and additions on the property. | Land | Improvement |
|---|---|---|---|---|
| 2025 | $8,363 | $527,240 | $158,172 | $369,068 |
| 2024 | $8,363 | $516,904 | $155,071 | $361,833 |
| 2023 | $8,752 | $506,770 | $152,031 | $354,739 |
| 2022 | $8,068 | $464,791 | $139,437 | $325,354 |
| 2021 | $7,677 | $455,680 | $136,704 | $318,976 |
| 2020 | $7,593 | $451,010 | $135,303 | $315,707 |
| 2019 | $7,286 | $442,170 | $132,651 | $309,519 |
| 2018 | $7,136 | $433,500 | $130,050 | $303,450 |
| 2017 | $6,856 | $425,000 | $127,500 | $297,500 |
| 2016 | $3,743 | $204,504 | $61,351 | $143,153 |
| 2015 | $3,625 | $201,434 | $60,430 | $141,004 |
| 2014 | $3,584 | $197,490 | $59,247 | $138,243 |
Map
- 3140 E 27th St
- 3234 E 27th St
- 3007 Bona St
- 3054 Bona St Unit D
- 3044 Blossom St
- 2883 Brookdale Ave
- 2858 Brookdale Ave
- 3251 Hyde St
- 3331 Davis St
- 3016 Brookdale Ave
- 23 Peroly Ct
- 2732 Garden St
- 2529 E 27th St
- 3035 Logan St
- 3035 Logan St
- 3227 Galindo St
- 3130 Nicol Ave
- 3114 Ashbrook Ct
- 2628 School St
- 2209 35th Ave
Ask me questions while you tour the home.