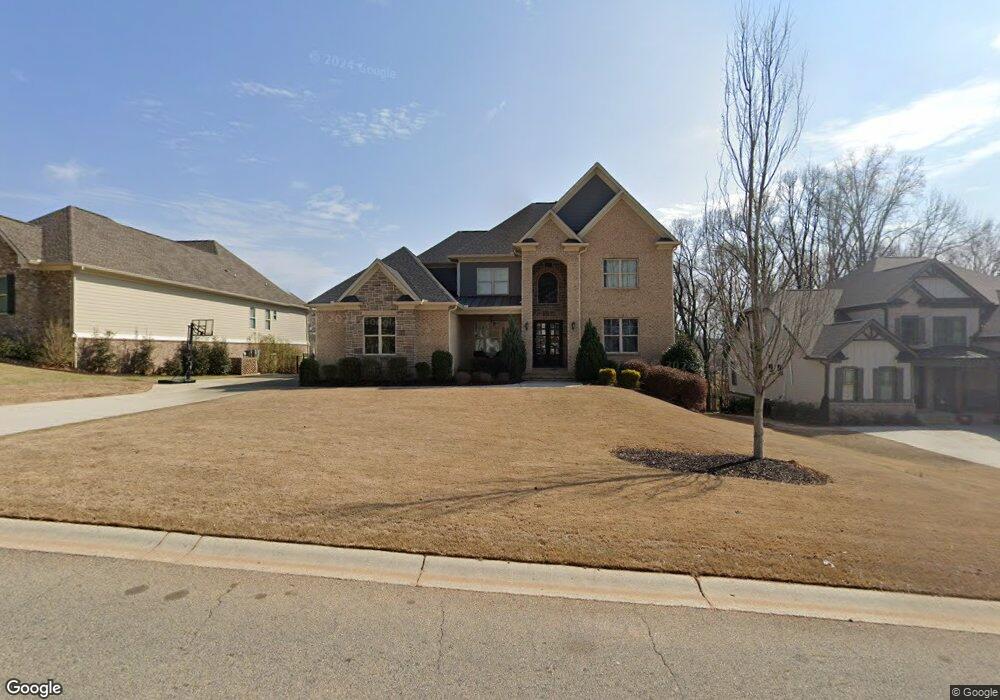
3023 Mulberry Greens Ln Unit E90 Jefferson, GA 30549
Estimated Value: $901,000 - $912,571
5
Beds
4
Baths
3,641
Sq Ft
$249/Sq Ft
Est. Value
About This Home
This home is located at 3023 Mulberry Greens Ln Unit E90, Jefferson, GA 30549 and is currently estimated at $905,643, approximately $248 per square foot. 3023 Mulberry Greens Ln Unit E90 is a home located in Jackson County with nearby schools including Gum Springs Elementary School, West Jackson Middle School, and Jackson County High School.
Ownership History
Date
Name
Owned For
Owner Type
Purchase Details
Closed on
May 16, 2025
Sold by
Galley John
Bought by
Ledford David and Ledford Tiffani
Current Estimated Value
Purchase Details
Closed on
Apr 30, 2018
Sold by
Webb Rachel
Bought by
John Galley and Galley Farrah
Home Financials for this Owner
Home Financials are based on the most recent Mortgage that was taken out on this home.
Original Mortgage
$388,650
Interest Rate
4.44%
Mortgage Type
New Conventional
Purchase Details
Closed on
Jul 29, 2016
Bought by
Webb Rachel
Purchase Details
Closed on
Aug 19, 2015
Sold by
Shaw Auston
Bought by
Property Svcs Inc
Purchase Details
Closed on
May 6, 2004
Sold by
Bluegreen Communities
Bought by
Shaw Auston
Create a Home Valuation Report for This Property
The Home Valuation Report is an in-depth analysis detailing your home's value as well as a comparison with similar homes in the area
Home Values in the Area
Average Home Value in this Area
Purchase History
| Date | Buyer | Sale Price | Title Company |
|---|---|---|---|
| Ledford David | $900,000 | -- | |
| John Galley | $588,650 | -- | |
| Webb Rachel | $472,000 | -- | |
| Property Svcs Inc | $35,000 | -- | |
| Shaw Auston | $137,700 | -- |
Source: Public Records
Mortgage History
| Date | Status | Borrower | Loan Amount |
|---|---|---|---|
| Previous Owner | John Galley | $388,650 |
Source: Public Records
Tax History Compared to Growth
Tax History
| Year | Tax Paid | Tax Assessment Tax Assessment Total Assessment is a certain percentage of the fair market value that is determined by local assessors to be the total taxable value of land and additions on the property. | Land | Improvement |
|---|---|---|---|---|
| 2024 | $9,797 | $379,820 | $36,000 | $343,820 |
| 2023 | $9,797 | $335,508 | $36,000 | $299,508 |
| 2022 | $7,847 | $271,708 | $32,400 | $239,308 |
| 2021 | $7,791 | $267,948 | $32,400 | $235,548 |
| 2020 | $6,953 | $218,828 | $32,400 | $186,428 |
| 2019 | $7,186 | $222,788 | $32,400 | $190,388 |
| 2018 | $6,835 | $209,440 | $32,400 | $177,040 |
| 2017 | $6,122 | $186,240 | $32,400 | $153,840 |
| 2016 | $467 | $32,400 | $32,400 | $0 |
| 2015 | $213 | $6,400 | $6,400 | $0 |
| 2014 | $214 | $6,400 | $6,400 | $0 |
| 2013 | -- | $4,000 | $4,000 | $0 |
Source: Public Records
Map
Nearby Homes
- 3028 Mulberry Greens Ln
- 3040 Mulberry Greens Ln
- 3330 Shady Creek Ct
- The Wynward Plan at Traditions of Braselton
- The Grayson Plan at Traditions of Braselton
- The Brookmont Plan at Traditions of Braselton
- The Rosewood Plan at Traditions of Braselton
- 4016 Links Blvd
- 4022 Links Blvd
- 4028 Links Blvd
- 4040 Links Blvd
- 4045 Links Blvd
- 4057 Links Blvd
- 4380 Links Blvd
- 3173 Mulberry Greens Ln
- 2227 Cotton Gin Row
- 799 Traditions Way
- 4341 Links Blvd
- 3111 Mulberry Greens Ln
- 3027 Mulberry Greens Ln
- 3027 Mulberry Greens Ln Unit 89E
- 3019 Mulberry Greens Ln
- 3020 Mulberry Greens Ln
- 3015 Mulberry Greens Ln
- 3031 Mulberry Greens Ln
- 3024 Mulberry Greens Ln
- 3028 Mulberry Greens Ln Unit 19
- 3014 Mulberry Greens Ln
- 3011 Mulberry Greens Ln
- 3035 Mulberry Greens Ln
- 3032 Mulberry Greens Ln
- 3010 Mulberry Greens Ln
- 3009 Mulberry Greens Ln
- 3405 River Birch Loop
- 3036 Mulberry Greens Ln
- 3370 Shady Creek Ct
- 3370 Shady Creek Ct Unit 29E
- 3360 Shady Creek Ct
- 3360 Shady Creek Ct Unit 28