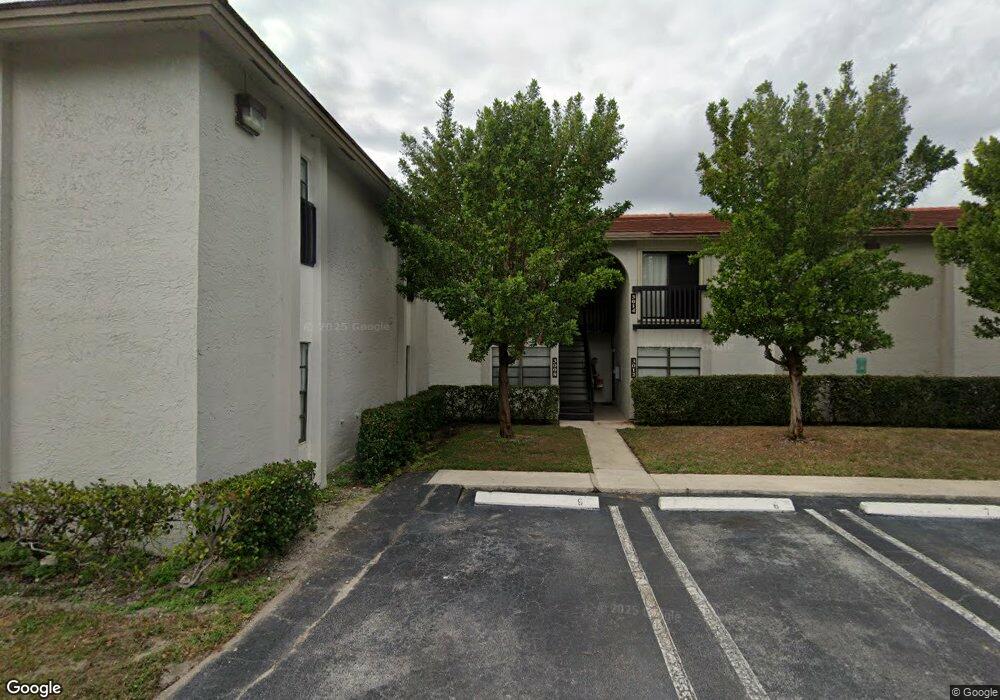
3023 NW 118th Dr Unit D219 Coral Springs, FL 33065
Estimated Value: $167,000 - $177,000
3
Beds
2
Baths
800
Sq Ft
$215/Sq Ft
Est. Value
About This Home
This home is located at 3023 NW 118th Dr Unit D219, Coral Springs, FL 33065 and is currently estimated at $172,095, approximately $215 per square foot. 3023 NW 118th Dr Unit D219 is a home located in Broward County with nearby schools including Westchester Elementary School, Sawgrass Springs Middle School, and Coral Glades High School.
Ownership History
Date
Name
Owned For
Owner Type
Purchase Details
Closed on
Jun 25, 2009
Sold by
Cardin Isidro
Bought by
Gibson Racquel
Current Estimated Value
Purchase Details
Closed on
May 17, 2008
Sold by
Residential Mortgage Solution Llc
Bought by
Cardin Isidro
Purchase Details
Closed on
May 14, 2008
Sold by
South Point Inc
Bought by
Residential Mortgage Solution Llc
Purchase Details
Closed on
Mar 21, 2007
Sold by
Horowitz Heather J and Mortgage Electronic Registrati
Bought by
South Point Inc
Purchase Details
Closed on
May 4, 2005
Sold by
Cypress Property Investments Llc
Bought by
Horowitz Heather J
Home Financials for this Owner
Home Financials are based on the most recent Mortgage that was taken out on this home.
Original Mortgage
$146,600
Interest Rate
5.98%
Mortgage Type
FHA
Create a Home Valuation Report for This Property
The Home Valuation Report is an in-depth analysis detailing your home's value as well as a comparison with similar homes in the area
Home Values in the Area
Average Home Value in this Area
Purchase History
| Date | Buyer | Sale Price | Title Company |
|---|---|---|---|
| Gibson Racquel | $48,000 | M&M Title Services Inc | |
| Cardin Isidro | $75,000 | Watson Title Insurance Inc | |
| Residential Mortgage Solution Llc | -- | Watson Title Insurance Inc | |
| South Point Inc | -- | None Available | |
| Horowitz Heather J | $150,000 | Great Country Title Services |
Source: Public Records
Mortgage History
| Date | Status | Borrower | Loan Amount |
|---|---|---|---|
| Previous Owner | Horowitz Heather J | $146,600 |
Source: Public Records
Tax History Compared to Growth
Tax History
| Year | Tax Paid | Tax Assessment Tax Assessment Total Assessment is a certain percentage of the fair market value that is determined by local assessors to be the total taxable value of land and additions on the property. | Land | Improvement |
|---|---|---|---|---|
| 2025 | $823 | $36,220 | -- | -- |
| 2024 | $775 | $35,200 | -- | -- |
| 2023 | $775 | $34,180 | $0 | $0 |
| 2022 | $738 | $33,190 | $0 | $0 |
| 2021 | $695 | $32,230 | $0 | $0 |
| 2020 | $661 | $31,790 | $0 | $0 |
| 2019 | $633 | $31,080 | $0 | $0 |
| 2018 | $568 | $30,510 | $0 | $0 |
| 2017 | $531 | $29,890 | $0 | $0 |
| 2016 | $509 | $29,280 | $0 | $0 |
| 2015 | $492 | $29,080 | $0 | $0 |
| 2014 | $481 | $28,850 | $0 | $0 |
| 2013 | -- | $35,940 | $3,590 | $32,350 |
Source: Public Records
Map
Nearby Homes
- 3013 NW 118th Dr Unit 225
- 3035 Coral Ridge Dr Unit 3035
- 3134 Coral Ridge Dr Unit 3136
- 11604 NW 29th Ct Unit C4
- 3220 Coral Ridge Dr Unit 3220
- 3218 Coral Ridge Dr Unit 3218
- 11607 NW 29th St Unit 3B
- 3242 Coral Ridge Dr Unit 3242
- 11515 NW 32nd Ct
- 11864 NW 28th St
- 12033 NW 29th St
- 2841 NW 112th Ave
- 11618 NW 27th St
- 11744 NW 26th Ct
- 11957 NW 26th Place
- 3501 NW 114th Ln
- 3525 NW 114th Ln
- 11862 NW 25th Ct
- 3600 NW 116th Terrace
- 3099 NW 123rd Ave
- 3035 NW 118th Dr Unit 222
- 11781 NW 30th St Unit 205
- 11767 NW 30th St Unit 108
- 3002 Coral Ridge Dr Unit 209
- 3006 Coral Ridge Dr Unit 210
- 3014 Coral Ridge Dr Unit 212
- 3010 Coral Ridge Dr
- 3022 Coral Ridge Dr Unit 214
- 3031 NW 118th Dr Unit 221
- 3041 NW 118th Dr Unit 226
- 3000 Coral Ridge Dr Unit 109
- 3017 NW 118th Dr Unit 224
- 3021 NW 118th Dr Unit 223
- 3036 Coral Ridge Dr Unit 3626
- 3027 NW 118th Dr Unit 22 -D
- 3036 Coral Ridge Dr Unit 3036
- 3027 NW 118th Dr
- 11777 NW 30th St
- 3028 Coral Ridge Dr Unit 216
- 11773 NW 30th St Unit 207