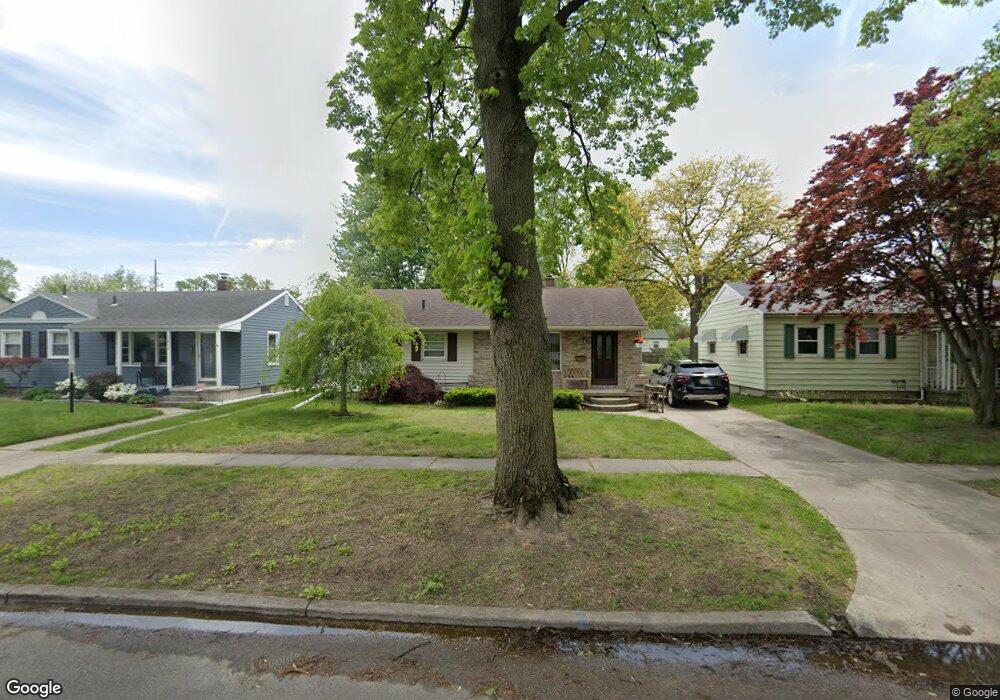
3023 Reen Dr Toledo, OH 43613
Whitmer-Trilby NeighborhoodEstimated Value: $180,277 - $206,000
3
Beds
2
Baths
912
Sq Ft
$208/Sq Ft
Est. Value
About This Home
This home is located at 3023 Reen Dr, Toledo, OH 43613 and is currently estimated at $189,569, approximately $207 per square foot. 3023 Reen Dr is a home located in Lucas County with nearby schools including Hiawatha Elementary School, Jefferson Junior High School, and Washington Junior High School.
Ownership History
Date
Name
Owned For
Owner Type
Purchase Details
Closed on
Dec 31, 2009
Sold by
Hsbc Bank Usa National Association
Bought by
Smieszek Randolph L
Current Estimated Value
Home Financials for this Owner
Home Financials are based on the most recent Mortgage that was taken out on this home.
Original Mortgage
$83,460
Interest Rate
5.37%
Mortgage Type
FHA
Purchase Details
Closed on
Oct 8, 2009
Sold by
Carter Richard P
Bought by
Hsbc Bank Usa
Purchase Details
Closed on
May 5, 2009
Sold by
Cater Richard P
Bought by
Wells Fargo Hsbc Bank Usa
Purchase Details
Closed on
Jul 31, 2002
Sold by
Baltzell Marcia H Tr and Richard L
Bought by
Cater Richard P and Cater Deborah I
Home Financials for this Owner
Home Financials are based on the most recent Mortgage that was taken out on this home.
Original Mortgage
$99,900
Interest Rate
6.62%
Create a Home Valuation Report for This Property
The Home Valuation Report is an in-depth analysis detailing your home's value as well as a comparison with similar homes in the area
Home Values in the Area
Average Home Value in this Area
Purchase History
| Date | Buyer | Sale Price | Title Company |
|---|---|---|---|
| Smieszek Randolph L | $85,000 | None Available | |
| Hsbc Bank Usa | -- | None Available | |
| Wells Fargo Hsbc Bank Usa | $70,000 | None Available | |
| Cater Richard P | $128,200 | Northwest Title Agency Of Oh |
Source: Public Records
Mortgage History
| Date | Status | Borrower | Loan Amount |
|---|---|---|---|
| Previous Owner | Smieszek Randolph L | $83,460 | |
| Previous Owner | Cater Richard P | $99,900 |
Source: Public Records
Tax History
| Year | Tax Paid | Tax Assessment Tax Assessment Total Assessment is a certain percentage of the fair market value that is determined by local assessors to be the total taxable value of land and additions on the property. | Land | Improvement |
|---|---|---|---|---|
| 2025 | -- | $55,370 | $9,415 | $45,955 |
| 2024 | $1,672 | $55,370 | $9,415 | $45,955 |
| 2023 | $2,711 | $37,975 | $7,385 | $30,590 |
| 2022 | $2,704 | $37,975 | $7,385 | $30,590 |
| 2021 | $2,813 | $37,975 | $7,385 | $30,590 |
| 2020 | $2,725 | $31,605 | $6,160 | $25,445 |
| 2019 | $2,645 | $31,605 | $6,160 | $25,445 |
| 2018 | $2,400 | $31,605 | $6,160 | $25,445 |
| 2017 | $2,390 | $29,155 | $5,390 | $23,765 |
| 2016 | $2,384 | $83,300 | $15,400 | $67,900 |
| 2015 | $2,376 | $83,300 | $15,400 | $67,900 |
| 2014 | $2,042 | $29,160 | $5,390 | $23,770 |
| 2013 | $2,042 | $29,160 | $5,390 | $23,770 |
Source: Public Records
Map
Nearby Homes
- 5111 Elaine Dr
- 2849 W Laskey Rd
- 5045 Fairgreen Dr
- 5103 Fairgreen Dr
- 5143 Fairgreen Dr
- 5163 Fairgreen Dr
- 5720 Secor Rd
- 4812 Secor Rd
- 2834 Wyndale Rd
- 2820 Eldora Dr
- 5215 Secor Rd
- 2846 Elsie Ave
- 4726 Bowen Rd
- 5420 Ruth Ave
- 3158 Oak Grove Place
- 2645 Boxwood Rd
- 2842 Oak Grove Place
- 3016 Lambert Dr
- 4932 Bales Rd
- 4914 Bales Rd
Your Personal Tour Guide
Ask me questions while you tour the home.