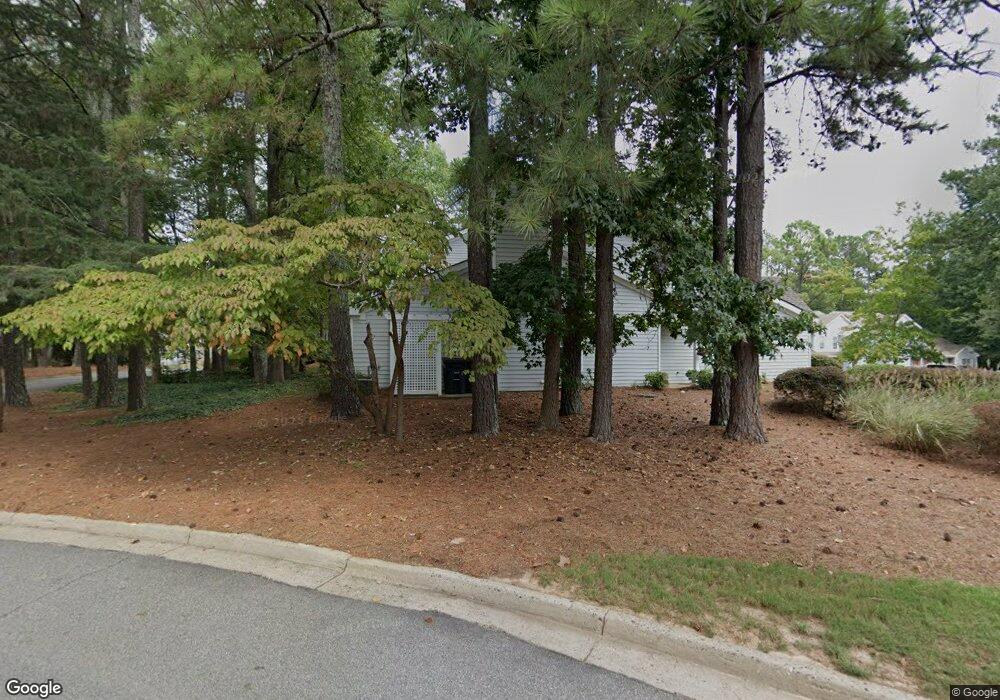
3023 Westwood Way Unit 3023 Alpharetta, GA 30004
Estimated Value: $251,000 - $327,000
2
Beds
2
Baths
1,384
Sq Ft
$215/Sq Ft
Est. Value
About This Home
This home is located at 3023 Westwood Way Unit 3023, Alpharetta, GA 30004 and is currently estimated at $298,063, approximately $215 per square foot. 3023 Westwood Way Unit 3023 is a home located in Fulton County with nearby schools including Manning Oaks Elementary School, Hopewell Middle School, and Alpharetta High School.
Ownership History
Date
Name
Owned For
Owner Type
Purchase Details
Closed on
Feb 28, 2011
Sold by
Shannon Deborah L
Bought by
Poindexter Deborah
Current Estimated Value
Home Financials for this Owner
Home Financials are based on the most recent Mortgage that was taken out on this home.
Original Mortgage
$105,282
Outstanding Balance
$72,611
Interest Rate
4.87%
Mortgage Type
FHA
Estimated Equity
$225,452
Purchase Details
Closed on
Jun 17, 2005
Sold by
White Laura L
Bought by
Shannon Deborah L
Home Financials for this Owner
Home Financials are based on the most recent Mortgage that was taken out on this home.
Original Mortgage
$108,000
Interest Rate
5.66%
Mortgage Type
VA
Purchase Details
Closed on
May 26, 1998
Sold by
Wood Ruth B
Bought by
White Laura L
Home Financials for this Owner
Home Financials are based on the most recent Mortgage that was taken out on this home.
Original Mortgage
$42,000
Interest Rate
7.11%
Mortgage Type
New Conventional
Create a Home Valuation Report for This Property
The Home Valuation Report is an in-depth analysis detailing your home's value as well as a comparison with similar homes in the area
Home Values in the Area
Average Home Value in this Area
Purchase History
| Date | Buyer | Sale Price | Title Company |
|---|---|---|---|
| Poindexter Deborah | -- | -- | |
| Shannon Deborah L | $117,000 | -- | |
| White Laura L | -- | -- | |
| Wood Ruth B | $84,000 | -- |
Source: Public Records
Mortgage History
| Date | Status | Borrower | Loan Amount |
|---|---|---|---|
| Open | Poindexter Deborah | $105,282 | |
| Previous Owner | Shannon Deborah L | $108,000 | |
| Previous Owner | Wood Ruth B | $42,000 | |
| Previous Owner | Wood Ruth B | $152,800 |
Source: Public Records
Tax History Compared to Growth
Tax History
| Year | Tax Paid | Tax Assessment Tax Assessment Total Assessment is a certain percentage of the fair market value that is determined by local assessors to be the total taxable value of land and additions on the property. | Land | Improvement |
|---|---|---|---|---|
| 2025 | $129 | $112,960 | $16,760 | $96,200 |
| 2023 | $3,056 | $108,280 | $18,440 | $89,840 |
| 2022 | $908 | $83,600 | $11,080 | $72,520 |
| 2021 | $965 | $70,720 | $9,360 | $61,360 |
| 2020 | $955 | $64,680 | $8,400 | $56,280 |
| 2019 | $93 | $63,520 | $8,240 | $55,280 |
| 2018 | $1,044 | $57,400 | $7,600 | $49,800 |
| 2017 | $849 | $45,120 | $11,280 | $33,840 |
| 2016 | $842 | $45,120 | $11,280 | $33,840 |
| 2015 | $905 | $45,120 | $11,280 | $33,840 |
| 2014 | $707 | $37,760 | $5,000 | $32,760 |
Source: Public Records
Map
Nearby Homes
- 3036 Westwood Way
- 3053 Westwood Way
- 4053 Whitehall Way
- 1035 Arborhill Ln
- 1630 Homestead Trail
- 4042 Whitehall Way
- 6023 Coventry Cir
- 6057 Coventry Cir
- 1519 Planters Ridge Ln
- 2847 Ashleigh Ln
- 2791 Ashleigh Ln Unit 179
- 2060 Monroe Dr
- 2741 Ashleigh Ln
- 1055 Poppy Pointe
- 122 Sterling Ct Unit 122
- 190 Crestwood Ct
- 4821 Devon Ln
- 12225 Clairmonte Ave
- 1050 Essex Ct
- 138 Sterling Ct
- 3024 Westwood Way
- 3025 Westwood Way Unit 3025
- 3027 Westwood Way
- 3035 Westwood Way Unit 3035
- 3011 Westwood Way
- 3052 Westwood Way Unit 3052
- 3052 Westwood Way
- 3052 Westwood Way
- 3051 Westwood Way Unit 3051
- 3013 Westwood Way
- 3054 Westwood Way
- 3031 Westwood Way
- 3016 Westwood Way Unit 3016
- 3015 Westwood Way
- 3041 Westwood Way
- 3055 Westwood Way
- 3056 Westwood Way Unit 3056
- 2023 Henderson Cir Unit 2023
- 3057 Westwood Way
- 3057 Westwood Way Unit 3057