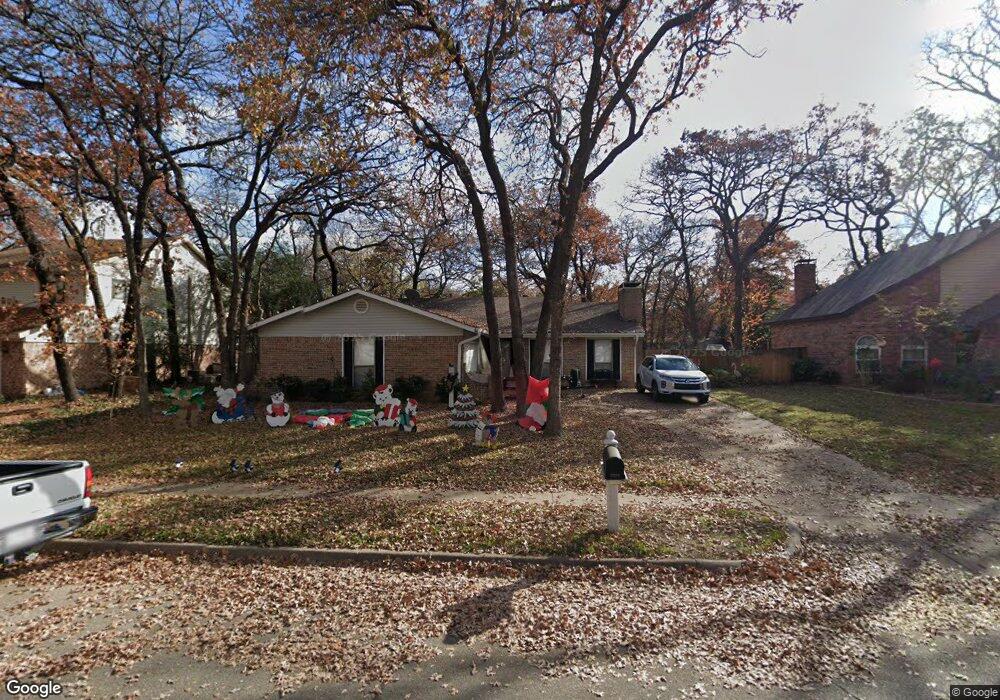
3024 Bent Tree Ln Bedford, TX 76021
Estimated Value: $377,000 - $395,000
3
Beds
2
Baths
1,899
Sq Ft
$202/Sq Ft
Est. Value
About This Home
This home is located at 3024 Bent Tree Ln, Bedford, TX 76021 and is currently estimated at $383,316, approximately $201 per square foot. 3024 Bent Tree Ln is a home located in Tarrant County with nearby schools including Meadow Creek Elementary School, Harwood Junior High School, and Trinity High School.
Ownership History
Date
Name
Owned For
Owner Type
Purchase Details
Closed on
Jun 1, 2014
Sold by
Franklin Randal T and Franklin Connie
Bought by
Davis Michael T and Davis Becky M
Current Estimated Value
Home Financials for this Owner
Home Financials are based on the most recent Mortgage that was taken out on this home.
Original Mortgage
$164,465
Outstanding Balance
$126,030
Interest Rate
4.4%
Mortgage Type
FHA
Estimated Equity
$257,286
Purchase Details
Closed on
Oct 4, 2011
Sold by
Holden Colleen B
Bought by
Franklin Randal T
Home Financials for this Owner
Home Financials are based on the most recent Mortgage that was taken out on this home.
Original Mortgage
$152,532
Interest Rate
4.25%
Mortgage Type
FHA
Purchase Details
Closed on
May 16, 2001
Sold by
Mahan Doug and Mahan Carolyn
Bought by
Holden Colleen B
Home Financials for this Owner
Home Financials are based on the most recent Mortgage that was taken out on this home.
Original Mortgage
$113,715
Interest Rate
7.07%
Mortgage Type
FHA
Create a Home Valuation Report for This Property
The Home Valuation Report is an in-depth analysis detailing your home's value as well as a comparison with similar homes in the area
Home Values in the Area
Average Home Value in this Area
Purchase History
| Date | Buyer | Sale Price | Title Company |
|---|---|---|---|
| Davis Michael T | -- | Stewart | |
| Franklin Randal T | -- | Hftc | |
| Holden Colleen B | -- | American Title Co |
Source: Public Records
Mortgage History
| Date | Status | Borrower | Loan Amount |
|---|---|---|---|
| Open | Davis Michael T | $164,465 | |
| Previous Owner | Franklin Randal T | $152,532 | |
| Previous Owner | Holden Colleen B | $113,715 |
Source: Public Records
Tax History Compared to Growth
Tax History
| Year | Tax Paid | Tax Assessment Tax Assessment Total Assessment is a certain percentage of the fair market value that is determined by local assessors to be the total taxable value of land and additions on the property. | Land | Improvement |
|---|---|---|---|---|
| 2025 | $5,583 | $376,022 | $75,000 | $301,022 |
| 2024 | $5,583 | $376,022 | $75,000 | $301,022 |
| 2023 | $6,150 | $371,000 | $45,000 | $326,000 |
| 2022 | $6,367 | $315,922 | $45,000 | $270,922 |
| 2021 | $6,242 | $296,689 | $45,000 | $251,689 |
| 2020 | $5,728 | $240,910 | $45,000 | $195,910 |
| 2019 | $5,853 | $240,910 | $45,000 | $195,910 |
| 2018 | $4,939 | $219,009 | $45,000 | $174,009 |
| 2017 | $4,877 | $209,416 | $30,000 | $179,416 |
| 2016 | $4,433 | $183,264 | $30,000 | $153,264 |
| 2015 | $4,095 | $174,000 | $18,000 | $156,000 |
| 2014 | $4,095 | $174,000 | $18,000 | $156,000 |
Source: Public Records
Map
Nearby Homes
- 3013 Bent Tree Ln
- 3024 Pecan Cir
- 3405 Scenic Hills Dr
- 3112 Hazlewood Ct
- 4001 Fairmont Ct
- 3017 Bluebonnet Ln
- 3713 Teal Ln
- 3909 Allendale St
- 3001 Glenwood Ct
- 3816 Rolling Meadows Dr
- 3409 Langley Hill Ln
- 3409 Crescent Ct
- 3932 Cedar Ridge Dr
- 3917 Autumn Ln
- 3428 Pembroke Place
- 2609 Talisman Ct
- 2904 Hickory Hill St
- 2904 Hickory Hill Ln
- 3209 Misty Ct
- 3721 Fieldcrest Ln
- 3028 Bent Tree Ln
- 3020 Bent Tree Ln
- 3021 Scenic Hills Dr
- 3017 Scenic Hills Dr
- 3016 Bent Tree Ln
- 3032 Bent Tree Ln
- 3013 Scenic Hills Dr
- 3025 Bent Tree Ln
- 3025 Scenic Hills Dr
- 3029 Bent Tree Ln
- 3021 Bent Tree Ln
- 3033 Bent Tree Ln
- 3009 Scenic Hills Dr
- 3012 Bent Tree Ln
- 3017 Bent Tree Ln
- 3037 Bent Tree Ln
- 3005 Scenic Hills Dr
- 3024 Old Orchard Ln
- 3020 Old Orchard Ln
- 3012 Scenic Hills Dr