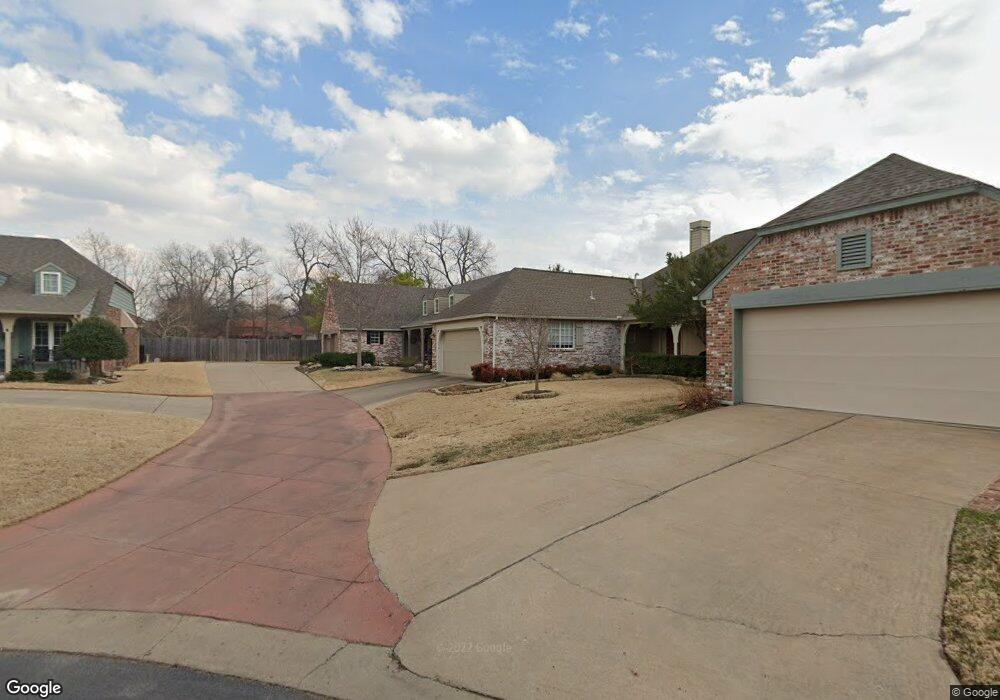
3024 E 93rd Ct Tulsa, OK 74137
College Park NeighborhoodEstimated Value: $337,000 - $380,000
3
Beds
3
Baths
2,493
Sq Ft
$145/Sq Ft
Est. Value
About This Home
This home is located at 3024 E 93rd Ct, Tulsa, OK 74137 and is currently estimated at $361,520, approximately $145 per square foot. 3024 E 93rd Ct is a home located in Tulsa County with nearby schools including Jenks East Elementary School, Jenks East Intermediate Elementary School, and Jenks Middle School.
Ownership History
Date
Name
Owned For
Owner Type
Purchase Details
Closed on
Aug 15, 2011
Sold by
White Nancy J
Bought by
Kindrick Wayne J and Kindrick Carol Anne
Current Estimated Value
Home Financials for this Owner
Home Financials are based on the most recent Mortgage that was taken out on this home.
Original Mortgage
$85,000
Outstanding Balance
$5,798
Interest Rate
4.65%
Mortgage Type
New Conventional
Estimated Equity
$355,722
Purchase Details
Closed on
Aug 25, 2003
Sold by
White Nancy J and White Donald F
Bought by
Heslar Nancy J and The Nancy J Heslar Trust
Purchase Details
Closed on
Jul 23, 1998
Sold by
Heslar Nancy J and Rutkauskas Otto
Bought by
Heslar Nancy J
Purchase Details
Closed on
May 11, 1998
Sold by
Heslar Nancy J
Bought by
Heslar Nancy J
Purchase Details
Closed on
Sep 1, 1992
Purchase Details
Closed on
Oct 1, 1991
Create a Home Valuation Report for This Property
The Home Valuation Report is an in-depth analysis detailing your home's value as well as a comparison with similar homes in the area
Home Values in the Area
Average Home Value in this Area
Purchase History
| Date | Buyer | Sale Price | Title Company |
|---|---|---|---|
| Kindrick Wayne J | $225,000 | Firstitle & Abstract Service | |
| Heslar Nancy J | -- | -- | |
| White Nancy J | -- | -- | |
| Heslar Nancy J | -- | Guaranty Abstract Company | |
| Heslar Nancy J | -- | Guaranty Abstract Company | |
| -- | $148,500 | -- | |
| -- | $27,500 | -- |
Source: Public Records
Mortgage History
| Date | Status | Borrower | Loan Amount |
|---|---|---|---|
| Open | Kindrick Wayne J | $85,000 |
Source: Public Records
Tax History
| Year | Tax Paid | Tax Assessment Tax Assessment Total Assessment is a certain percentage of the fair market value that is determined by local assessors to be the total taxable value of land and additions on the property. | Land | Improvement |
|---|---|---|---|---|
| 2025 | $4,100 | $29,003 | $3,110 | $25,893 |
| 2024 | $3,632 | $28,129 | $2,955 | $25,174 |
| 2023 | $3,632 | $28,280 | $3,286 | $24,994 |
| 2022 | $3,633 | $26,457 | $3,822 | $22,635 |
| 2021 | $3,571 | $25,657 | $3,706 | $21,951 |
| 2020 | $3,496 | $25,657 | $3,706 | $21,951 |
| 2019 | $3,615 | $25,657 | $3,706 | $21,951 |
| 2018 | $3,612 | $25,657 | $3,706 | $21,951 |
| 2017 | $3,527 | $26,657 | $3,850 | $22,807 |
| 2016 | $3,594 | $27,039 | $3,850 | $23,189 |
| 2015 | $3,869 | $29,997 | $3,850 | $26,147 |
| 2014 | $3,743 | $27,687 | $3,850 | $23,837 |
Source: Public Records
Map
Nearby Homes
- 9417 S Gary Ave
- 9432 S Florence Ave
- 9559 S College Ct
- 3113 E 91st Place
- 3335 E 93rd St
- 9436 S Jamestown Ave
- 9327 S Jamestown Ave
- 9022 S College Ave Unit 2108
- 2834 E 90th St Unit 1802
- 2850 E 90th St Unit 1208
- 2826 E 90th St Unit 1602
- 9031 S Delaware Ave Unit 703
- 3149 E 89th St
- 8751 S College Place
- 8626 S Florence Ave
- 8614 S College Place
- 8710 S Delaware Place
- 3334 E 100th Place
- 2934 E 101st Place
- 4418 E 93rd Place S
- 3020 E 93rd Ct
- 3028 E 93rd Ct
- 3016 E 93rd Ct
- 9341 S College Ct
- 9337 S College Ct
- 3023 E 93rd Ct
- 9333 S College Ct
- 3019 E 93rd Ct
- 9345 S College Ct
- 3015 E 93rd Ct
- 9349 S College Ct
- 3011 E 93rd Ct
- 9315 S College Ct
- 9340 S Florence Ave
- 9353 S College Ct
- 3014 E 93rd St
- 3202 E 93rd St
- 3005 E 93rd Ct
- 9361 S College Ct
- 9357 S College Ct
Your Personal Tour Guide
Ask me questions while you tour the home.