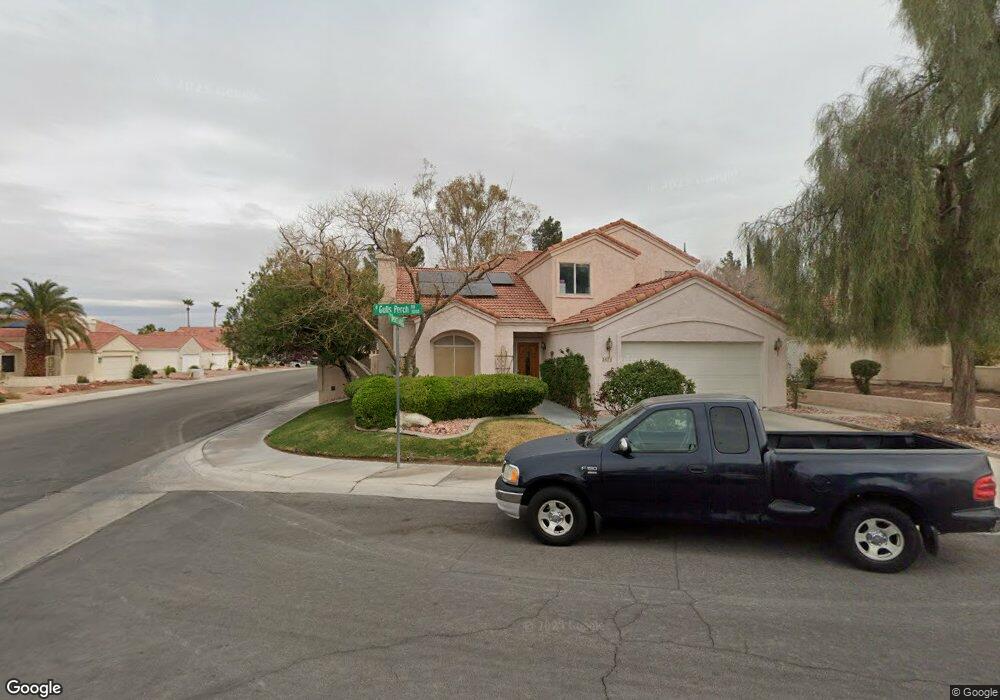
3024 Gulls Perch Dr Las Vegas, NV 89128
Desert Shores NeighborhoodEstimated Value: $587,000 - $674,000
5
Beds
4
Baths
2,531
Sq Ft
$245/Sq Ft
Est. Value
About This Home
This home is located at 3024 Gulls Perch Dr, Las Vegas, NV 89128 and is currently estimated at $621,302, approximately $245 per square foot. 3024 Gulls Perch Dr is a home located in Clark County with nearby schools including Dorothy Eisenberg Elementary School, Marc Kahre Elementary School, and Ernest Becker Middle School.
Ownership History
Date
Name
Owned For
Owner Type
Purchase Details
Closed on
Oct 12, 2021
Sold by
Salas Jacquelline
Bought by
Salas Jacqueline
Current Estimated Value
Home Financials for this Owner
Home Financials are based on the most recent Mortgage that was taken out on this home.
Original Mortgage
$317,000
Outstanding Balance
$289,074
Interest Rate
2.8%
Mortgage Type
New Conventional
Estimated Equity
$332,228
Purchase Details
Closed on
Apr 7, 2009
Sold by
Salas Richard J
Bought by
Salas Jacqueline
Purchase Details
Closed on
Aug 29, 2001
Sold by
Correll Curtis R
Bought by
Salas Jacqueline M and Salas Richard J
Home Financials for this Owner
Home Financials are based on the most recent Mortgage that was taken out on this home.
Original Mortgage
$193,375
Interest Rate
8.5%
Purchase Details
Closed on
Jun 26, 2000
Sold by
Hopkins Jerry T and Hopkins Donna C
Bought by
Correll Curtis R
Home Financials for this Owner
Home Financials are based on the most recent Mortgage that was taken out on this home.
Original Mortgage
$184,865
Interest Rate
8.12%
Create a Home Valuation Report for This Property
The Home Valuation Report is an in-depth analysis detailing your home's value as well as a comparison with similar homes in the area
Home Values in the Area
Average Home Value in this Area
Purchase History
| Date | Buyer | Sale Price | Title Company |
|---|---|---|---|
| Salas Jacqueline | -- | National Closing Solution | |
| Salas Jacqueline | -- | None Available | |
| Salas Jacqueline M | $227,500 | First American Title Co | |
| Correll Curtis R | $217,500 | Old Republic Title Company |
Source: Public Records
Mortgage History
| Date | Status | Borrower | Loan Amount |
|---|---|---|---|
| Open | Salas Jacqueline | $317,000 | |
| Closed | Salas Jacqueline M | $193,375 | |
| Previous Owner | Correll Curtis R | $184,865 |
Source: Public Records
Tax History Compared to Growth
Tax History
| Year | Tax Paid | Tax Assessment Tax Assessment Total Assessment is a certain percentage of the fair market value that is determined by local assessors to be the total taxable value of land and additions on the property. | Land | Improvement |
|---|---|---|---|---|
| 2025 | $2,903 | $116,922 | $41,300 | $75,622 |
| 2024 | $2,819 | $116,922 | $41,300 | $75,622 |
| 2023 | $2,300 | $109,933 | $37,450 | $72,483 |
| 2022 | $2,737 | $97,772 | $30,800 | $66,972 |
| 2021 | $2,657 | $92,813 | $28,700 | $64,113 |
| 2020 | $2,577 | $93,805 | $29,750 | $64,055 |
| 2019 | $2,502 | $88,796 | $25,200 | $63,596 |
| 2018 | $2,429 | $84,113 | $22,750 | $61,363 |
| 2017 | $2,695 | $82,108 | $19,600 | $62,508 |
| 2016 | $2,300 | $80,362 | $16,450 | $63,912 |
| 2015 | $2,295 | $75,161 | $12,250 | $62,911 |
| 2014 | $2,228 | $65,842 | $11,550 | $54,292 |
Source: Public Records
Map
Nearby Homes
- 3150 Soft Breezes Dr Unit 2220
- 3150 Soft Breezes Dr Unit 2218
- 3150 Soft Breezes Dr Unit 2186
- 3150 Soft Breezes Dr Unit 1034
- 3150 Soft Breezes Dr Unit 1167
- 3150 Soft Breezes Dr Unit 1192
- 3150 Soft Breezes Dr Unit 1033
- 3150 Soft Breezes Dr Unit 1050
- 3012 Windy Surf Ct
- 3125 N Buffalo Dr Unit 2102
- 3125 N Buffalo Dr Unit 1088
- 3125 N Buffalo Dr Unit 1136
- 3125 N Buffalo Dr Unit 2156
- 3125 N Buffalo Dr Unit 1078
- 3125 N Buffalo Dr Unit 2153
- 3125 N Buffalo Dr Unit 1090
- 3125 N Buffalo Dr Unit 2104
- 3125 N Buffalo Dr Unit 1103
- 3125 N Buffalo Dr Unit 2103
- 3125 N Buffalo Dr Unit 1160
- 3020 Gulls Perch Dr
- 3016 Gulls Perch Dr
- 3017 Windy Surf Ct
- 3013 Windy Surf Ct
- 7712 Desert Delta Dr
- 3009 Windy Surf Ct
- 7708 Desert Delta Dr
- 7716 Desert Delta Dr
- 3029 Gulls Perch Dr
- 7704 Desert Delta Dr
- 7720 Desert Delta Dr
- 3012 Gulls Perch Dr
- 3005 Windy Surf Ct
- 3025 Gulls Perch Dr
- 3008 Gulls Perch Dr
- 7724 Desert Delta Dr
- 3021 Gulls Perch Dr
- 3001 Windy Surf Ct
- 3020 Yeoman Cir
- 3004 Gulls Perch Dr