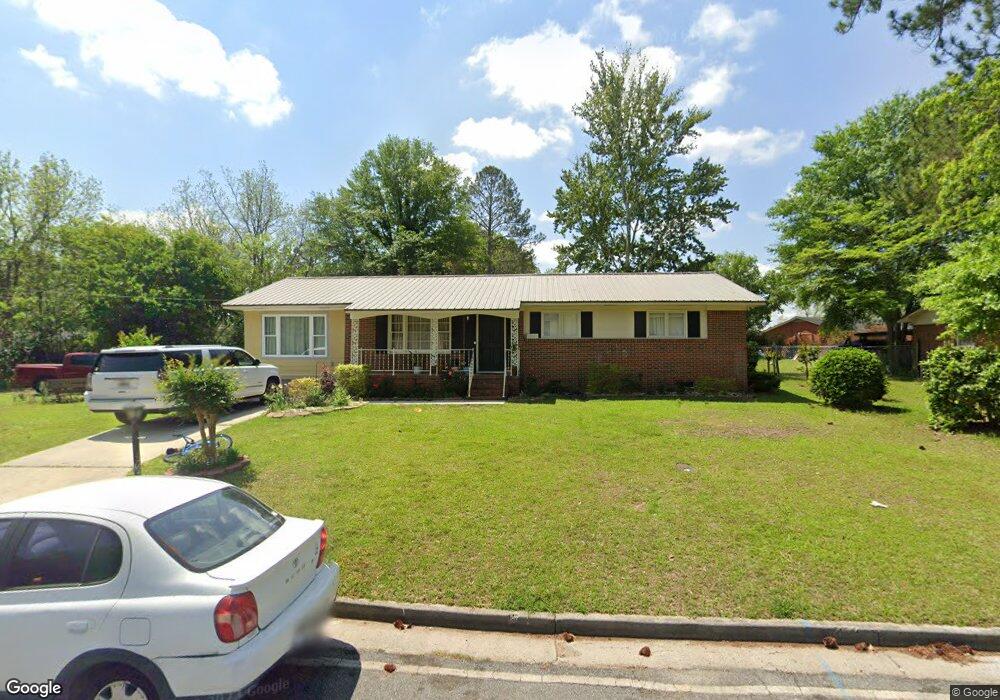
3024 Ivy Dr Tifton, GA 31794
Estimated Value: $129,000 - $234,884
3
Beds
3
Baths
1,491
Sq Ft
$132/Sq Ft
Est. Value
About This Home
This home is located at 3024 Ivy Dr, Tifton, GA 31794 and is currently estimated at $197,221, approximately $132 per square foot. 3024 Ivy Dr is a home located in Tift County with nearby schools including Northside Primary School, Charles Spencer Elementary School, and J.T. Reddick School.
Ownership History
Date
Name
Owned For
Owner Type
Purchase Details
Closed on
Jul 29, 2016
Sold by
Bloodworth George D
Bought by
Moreno Idania and Castillo Gaston
Current Estimated Value
Home Financials for this Owner
Home Financials are based on the most recent Mortgage that was taken out on this home.
Original Mortgage
$55,000
Outstanding Balance
$5,874
Interest Rate
3.48%
Mortgage Type
New Conventional
Estimated Equity
$191,347
Purchase Details
Closed on
Dec 30, 1969
Sold by
Whatley Lacy
Bought by
Bryan Yaney and Lena Ramona
Create a Home Valuation Report for This Property
The Home Valuation Report is an in-depth analysis detailing your home's value as well as a comparison with similar homes in the area
Home Values in the Area
Average Home Value in this Area
Purchase History
| Date | Buyer | Sale Price | Title Company |
|---|---|---|---|
| Moreno Idania | $85,000 | -- | |
| Bryan Yaney | -- | -- |
Source: Public Records
Mortgage History
| Date | Status | Borrower | Loan Amount |
|---|---|---|---|
| Open | Moreno Idania | $55,000 |
Source: Public Records
Tax History Compared to Growth
Tax History
| Year | Tax Paid | Tax Assessment Tax Assessment Total Assessment is a certain percentage of the fair market value that is determined by local assessors to be the total taxable value of land and additions on the property. | Land | Improvement |
|---|---|---|---|---|
| 2024 | $2,614 | $96,951 | $8,000 | $88,951 |
| 2023 | $2,779 | $43,787 | $3,200 | $40,587 |
| 2022 | $1,528 | $40,614 | $3,200 | $37,414 |
| 2021 | $1,281 | $33,810 | $3,200 | $30,610 |
| 2020 | $1,312 | $33,810 | $3,200 | $30,610 |
| 2019 | $1,300 | $33,478 | $3,200 | $30,278 |
| 2018 | $1,301 | $33,478 | $3,200 | $30,278 |
| 2017 | $1,184 | $29,714 | $3,200 | $26,514 |
| 2016 | $1,186 | $29,714 | $3,200 | $26,514 |
| 2015 | $1,187 | $29,714 | $3,200 | $26,514 |
| 2014 | $1,189 | $29,714 | $3,200 | $26,514 |
| 2013 | -- | $29,713 | $3,200 | $26,513 |
Source: Public Records
Map
Nearby Homes