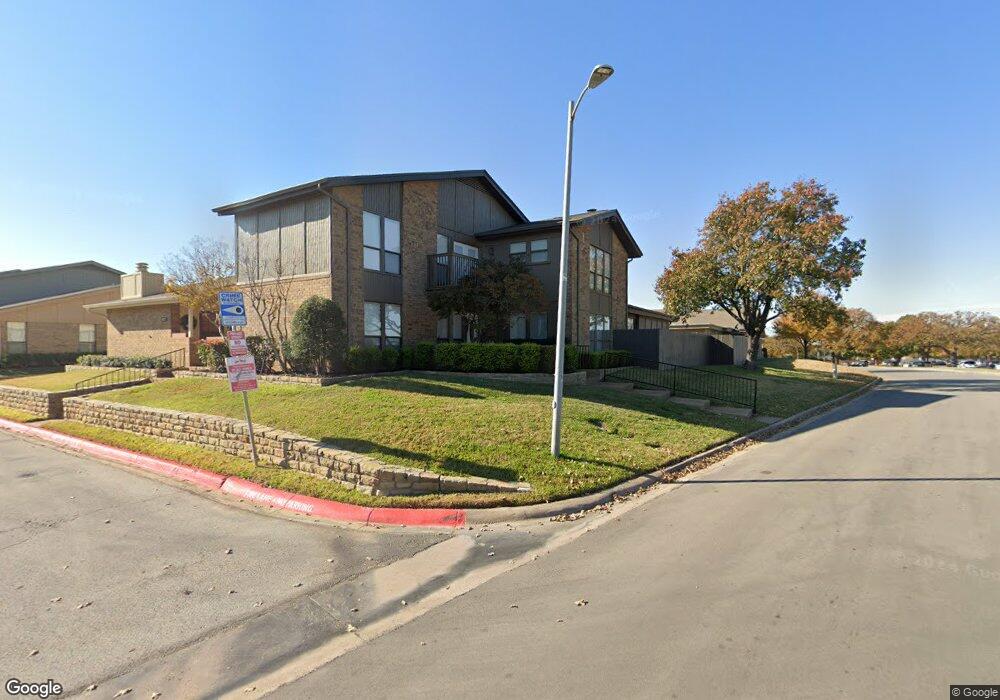
3024 Shady Knoll Ln Bedford, TX 76021
Estimated Value: $305,000 - $355,702
3
Beds
3
Baths
2,381
Sq Ft
$141/Sq Ft
Est. Value
About This Home
This home is located at 3024 Shady Knoll Ln, Bedford, TX 76021 and is currently estimated at $335,176, approximately $140 per square foot. 3024 Shady Knoll Ln is a home located in Tarrant County with nearby schools including Bedford Heights Elementary School, Bedford Junior High School, and L.D. Bell High School.
Ownership History
Date
Name
Owned For
Owner Type
Purchase Details
Closed on
Jun 5, 2024
Sold by
Cannon Evelyn Elaine
Bought by
Cannon Evelyn Elaine and Ross Cristin
Current Estimated Value
Purchase Details
Closed on
Sep 25, 2007
Sold by
Cannon Larry Lynn
Bought by
Cannon Evelyn Elaine
Purchase Details
Closed on
Mar 10, 2006
Sold by
Moriarty Patti K
Bought by
Cannon Larry and Cannon Evelyn
Home Financials for this Owner
Home Financials are based on the most recent Mortgage that was taken out on this home.
Original Mortgage
$29,000
Interest Rate
6.19%
Mortgage Type
Fannie Mae Freddie Mac
Purchase Details
Closed on
Dec 9, 1999
Sold by
Maar Catherine M
Bought by
Moriarty Patti K
Home Financials for this Owner
Home Financials are based on the most recent Mortgage that was taken out on this home.
Original Mortgage
$89,900
Interest Rate
7.71%
Mortgage Type
Purchase Money Mortgage
Create a Home Valuation Report for This Property
The Home Valuation Report is an in-depth analysis detailing your home's value as well as a comparison with similar homes in the area
Home Values in the Area
Average Home Value in this Area
Purchase History
| Date | Buyer | Sale Price | Title Company |
|---|---|---|---|
| Cannon Evelyn Elaine | -- | None Listed On Document | |
| Cannon Evelyn Elaine | -- | None Available | |
| Cannon Larry | -- | Alamo Title Company | |
| Moriarty Patti K | -- | Alamo Title Co |
Source: Public Records
Mortgage History
| Date | Status | Borrower | Loan Amount |
|---|---|---|---|
| Previous Owner | Cannon Larry | $29,000 | |
| Previous Owner | Moriarty Patti K | $89,900 |
Source: Public Records
Tax History Compared to Growth
Tax History
| Year | Tax Paid | Tax Assessment Tax Assessment Total Assessment is a certain percentage of the fair market value that is determined by local assessors to be the total taxable value of land and additions on the property. | Land | Improvement |
|---|---|---|---|---|
| 2025 | $3,078 | $361,845 | $55,000 | $306,845 |
| 2024 | $3,078 | $361,845 | $55,000 | $306,845 |
| 2023 | $3,162 | $344,467 | $35,000 | $309,467 |
| 2022 | $5,746 | $275,736 | $35,000 | $240,736 |
| 2021 | $5,634 | $288,419 | $35,000 | $253,419 |
| 2020 | $5,169 | $236,787 | $35,000 | $201,787 |
| 2019 | $4,802 | $243,874 | $35,000 | $208,874 |
| 2018 | $3,983 | $179,685 | $35,000 | $144,685 |
| 2017 | $3,952 | $177,368 | $35,000 | $142,368 |
| 2016 | $3,592 | $153,752 | $35,000 | $118,752 |
| 2015 | $3,115 | $135,000 | $5,950 | $129,050 |
| 2014 | $3,115 | $135,000 | $5,950 | $129,050 |
Source: Public Records
Map
Nearby Homes
- 320 Blue Quail Ct
- 432 Sunnybrook Ct
- 3213 Spring Valley Dr
- 3119 Spring Grove Dr
- 305 Warbler Dr
- 801 Shady Creek Ln
- 817 Shady Lake Dr
- 922 Shady Creek Ln
- 913 Kensington Ct
- 121 Kay Ct
- 405 Woodbriar Ct
- 1740 Brown Trail
- 124 Jeannie Ct
- 3605 Spring Valley Dr
- 1732 Jeannie Ln
- 2436 Brookgreen Ct
- 1013 Springdale Rd
- 2420 Stonegate Dr N
- 3609 Wayne Ct
- 2704 Shady Grove Dr
- 3022 Shady Knoll Ln
- 3020 Shady Knoll Ln
- 3012 Rustling Leaves Ln
- 3010 Rustling Leaves Ln
- 400 Carolyn Dr
- 3018 Shady Knoll Ln
- 402 Carolyn Dr
- 3008 Rustling Leaves Ln
- 3016 Shady Knoll Ln
- 404 Carolyn Dr
- 3014 Shady Knoll Ln
- 3002 Rustling Leaves Ln
- 3011 Shady Knoll Ln
- 3009 Shady Knoll Ln
- 3000 Rustling Leaves Ln
- 406 Carolyn Dr
- 3007 Shady Knoll Ln
- 3011 Rustling Leaves Ln
- 3009 Rustling Leaves Ln
- 408 Carolyn Dr