30241 Maystead Rd Burr Oak, MI 49030
Estimated Value: $199,000 - $524,000
3
Beds
1
Bath
1,680
Sq Ft
$212/Sq Ft
Est. Value
About This Home
This home is located at 30241 Maystead Rd, Burr Oak, MI 49030 and is currently estimated at $356,416, approximately $212 per square foot. 30241 Maystead Rd is a home located in St. Joseph County with nearby schools including Burr Oak Elementary School and Burr Oak High School.
Ownership History
Date
Name
Owned For
Owner Type
Purchase Details
Closed on
Apr 16, 2018
Sold by
Bontrager Susei
Bought by
Bontrrager Joseph and Bontrrager Susie
Current Estimated Value
Purchase Details
Closed on
Mar 1, 2017
Sold by
Bontrager Joseph
Bought by
Bontrager Susie and Bontrager Joseph
Purchase Details
Closed on
Nov 6, 2014
Sold by
Yoder Sheldon D and Yoder Sarah Jean
Bought by
Bontrager Joseph J
Home Financials for this Owner
Home Financials are based on the most recent Mortgage that was taken out on this home.
Original Mortgage
$96,000
Interest Rate
4.1%
Mortgage Type
Purchase Money Mortgage
Purchase Details
Closed on
Apr 13, 2006
Sold by
Yoder Dennis D and Yoder Alma
Bought by
Yoder Sheldon D and Yoder Sarah Jean
Purchase Details
Closed on
Jul 1, 2004
Sold by
Caldwell David T
Bought by
Citizens Bank
Purchase Details
Closed on
Oct 30, 2002
Sold by
King Farms
Bought by
Caldwell David T
Create a Home Valuation Report for This Property
The Home Valuation Report is an in-depth analysis detailing your home's value as well as a comparison with similar homes in the area
Home Values in the Area
Average Home Value in this Area
Purchase History
| Date | Buyer | Sale Price | Title Company |
|---|---|---|---|
| Bontrrager Joseph | -- | Patrick Abstract And Title O | |
| Bontrager Susie | -- | Attorney | |
| Bontrager Joseph J | $120,000 | Attorneys Title Agency | |
| Yoder Sheldon D | -- | None Available | |
| Citizens Bank | $80,465 | -- | |
| Caldwell David T | -- | -- |
Source: Public Records
Mortgage History
| Date | Status | Borrower | Loan Amount |
|---|---|---|---|
| Previous Owner | Bontrager Joseph J | $96,000 |
Source: Public Records
Tax History Compared to Growth
Tax History
| Year | Tax Paid | Tax Assessment Tax Assessment Total Assessment is a certain percentage of the fair market value that is determined by local assessors to be the total taxable value of land and additions on the property. | Land | Improvement |
|---|---|---|---|---|
| 2025 | $3,073 | $240,600 | $60,300 | $180,300 |
| 2024 | $1,328 | $181,700 | $36,600 | $145,100 |
| 2023 | $1,266 | $152,700 | $22,000 | $130,700 |
| 2022 | $0 | $134,700 | $38,400 | $96,300 |
| 2021 | $2,706 | $128,900 | $22,000 | $106,900 |
| 2020 | $2,681 | $115,400 | $20,400 | $95,000 |
| 2019 | $1,893 | $78,700 | $19,700 | $59,000 |
| 2018 | $1,178 | $53,300 | $14,700 | $38,600 |
| 2017 | $1,134 | $50,100 | $50,100 | $0 |
| 2016 | -- | $53,200 | $53,200 | $0 |
| 2015 | -- | $48,800 | $0 | $0 |
| 2014 | -- | $50,000 | $50,000 | $0 |
| 2012 | -- | $45,600 | $45,600 | $0 |
Source: Public Records
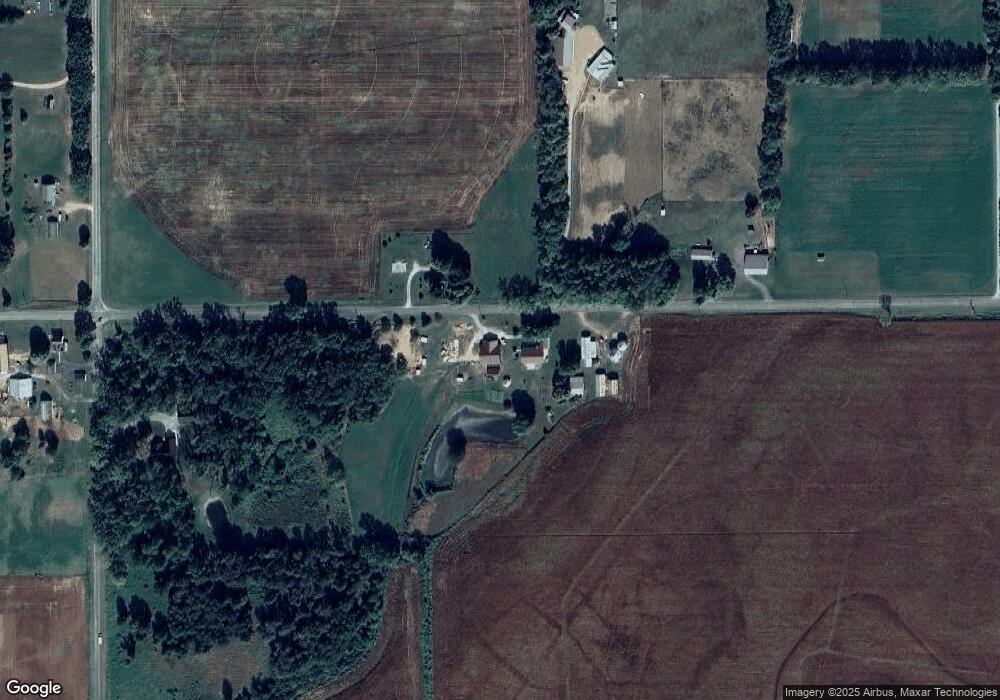
Map
Nearby Homes
- 832 W Front St
- 28195 Blackberry Ln
- 63890 Middle Colon Rd
- 63810 Middle Colon Rd
- V/L White Pine Dr
- 27810 Maystead Rd
- 28123 Timberly Dr
- VL County Farm Rd
- 0 V L M66- 102+ - Unit 24045986
- 427 E Main St
- 229 Burr Oak Rd
- 66223 Grey Lake Rd
- 1100 Sherwood Forrest Trail
- 31301 E Lafayette Rd
- 68433 Sweet Lake Rd
- 66109 Hideaway Ln
- 814 N Lakeview Ave
- 708 N Centerville Rd
- 0 N Centerville Rd
- 612 N Prospect St
- 30328 Maystead Rd
- 30252 Maystead Rd
- 64700 Carpenterson Rd
- 64940 Carpenterson Rd
- 64860 Carpenterson Rd
- 29985 Maystead Rd
- 64820 Carpenterson Rd
- 29910 Maystead Rd
- 64754 Carpenterson Rd
- 28978 Maystead Rd
- 30450 Maystead Rd
- 65340 Carpenterson Rd
- 29798 Maystead Rd
- 29754 Maystead Rd
- 64610 Carpenterson Rd
- 29650 Maystead Rd
- 64440 Carpenterson Rd
- 65530 Carpenterson Rd
- 65408 Carpenterson Rd
- 30858 Maystead Rd