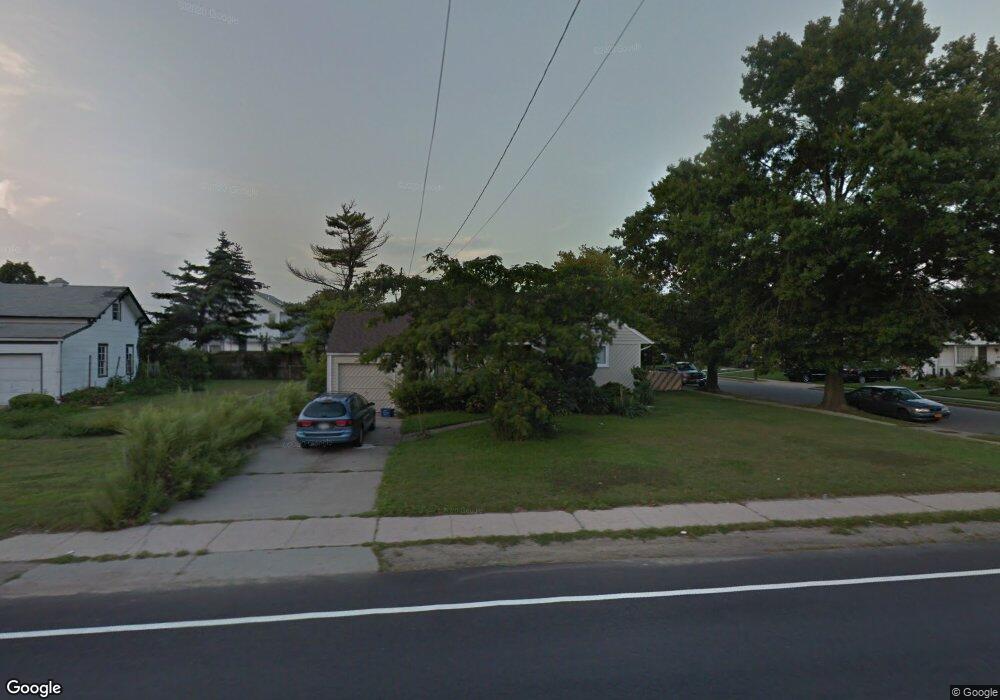
3025 Brower Ave Oceanside, NY 11572
Estimated Value: $522,000 - $674,855
3
Beds
2
Baths
1,036
Sq Ft
$578/Sq Ft
Est. Value
About This Home
This home is located at 3025 Brower Ave, Oceanside, NY 11572 and is currently estimated at $598,428, approximately $577 per square foot. 3025 Brower Ave is a home located in Nassau County with nearby schools including Oaks Elementary School - School 3, Oceanside Middle School, and Oceanside High School.
Ownership History
Date
Name
Owned For
Owner Type
Purchase Details
Closed on
Dec 17, 2024
Sold by
Blue Sky Inc
Bought by
Sadiq Areeba
Current Estimated Value
Home Financials for this Owner
Home Financials are based on the most recent Mortgage that was taken out on this home.
Original Mortgage
$372,750
Outstanding Balance
$369,515
Interest Rate
6.84%
Mortgage Type
New Conventional
Estimated Equity
$228,913
Purchase Details
Closed on
Sep 1, 2023
Sold by
Reeves John and Reeves Antonette
Bought by
Blue Sky Inc
Home Financials for this Owner
Home Financials are based on the most recent Mortgage that was taken out on this home.
Original Mortgage
$308,000
Interest Rate
7.18%
Mortgage Type
Construction
Purchase Details
Closed on
Mar 11, 2011
Sold by
Cellars Marie
Bought by
Reeves John
Create a Home Valuation Report for This Property
The Home Valuation Report is an in-depth analysis detailing your home's value as well as a comparison with similar homes in the area
Home Values in the Area
Average Home Value in this Area
Purchase History
| Date | Buyer | Sale Price | Title Company |
|---|---|---|---|
| Sadiq Areeba | $497,000 | First American Title Ins Co | |
| Sadiq Areeba | $497,000 | First American Title Ins Co | |
| Sadiq Areeba | $497,000 | First American Title Ins Co | |
| Sadiq Areeba | $497,000 | First American Title Ins Co | |
| Blue Sky Inc | -- | Beta Abstract Llc | |
| Blue Sky Inc | -- | Beta Abstract Llc | |
| Blue Sky Inc | -- | Beta Abstract Llc | |
| Blue Sky Inc | -- | Beta Abstract Llc | |
| Blue Sky Inc | -- | Beta Abstract Llc | |
| Reeves John | $330,000 | -- | |
| Reeves John | $330,000 | -- | |
| Reeves John | $330,000 | -- | |
| Reeves John | $330,000 | -- |
Source: Public Records
Mortgage History
| Date | Status | Borrower | Loan Amount |
|---|---|---|---|
| Open | Sadiq Areeba | $372,750 | |
| Closed | Sadiq Areeba | $372,750 | |
| Previous Owner | Blue Sky Inc | $308,000 |
Source: Public Records
Tax History
| Year | Tax Paid | Tax Assessment Tax Assessment Total Assessment is a certain percentage of the fair market value that is determined by local assessors to be the total taxable value of land and additions on the property. | Land | Improvement |
|---|---|---|---|---|
| 2025 | $11,874 | $430 | $205 | $225 |
| 2024 | $3,458 | $430 | $205 | $225 |
| 2023 | $9,754 | $430 | $205 | $225 |
| 2022 | $9,754 | $430 | $205 | $225 |
| 2021 | $13,048 | $415 | $198 | $217 |
| 2020 | $12,343 | $596 | $581 | $15 |
| 2019 | $8,884 | $596 | $455 | $141 |
| 2018 | $8,324 | $761 | $0 | $0 |
| 2017 | $6,207 | $761 | $581 | $180 |
| 2016 | $9,690 | $761 | $581 | $180 |
| 2015 | $3,327 | $761 | $533 | $228 |
| 2014 | $3,327 | $761 | $533 | $228 |
| 2013 | $3,093 | $761 | $581 | $180 |
Source: Public Records
Map
Nearby Homes
- 3195 Nantucket Ln
- 30 Gifford Ave
- 222 Chance Dr
- 2860 Nicole Ct
- 2975 Oceanside Rd
- 3354 Knight St
- 2778 King St
- 3309 Skillman Ave
- 254 Elizabeth Ave
- 25 Sunnybrook Dr E
- 3251 Neptune Ave
- 2941 Moreland Ave
- 3432 Bayfield Blvd
- 613 Smith Place
- 528 Carpenter Ave
- 2730 Remsen St
- 197 Foxhurst Rd
- 3483 Frederick St
- 3154 Roxbury Rd
- 647 Lincoln St
- 3014 Brower Ave
- 3000 Harvey Ave
- 3017 Brower Ave
- 3015 Harvey Ave
- 3011 Brower Ave
- 2982 Harvey Ave
- 3080 Benjamin Rd
- 3007 Harvey Ave
- 3016 Brower Ave
- 2976 Harvey Ave
- 3045 Brower Ave
- 3005 Brower Ave
- 3075 Ralph Ave
- 3079 Benjamin Rd
- 2970 Harvey Ave
- 3092 Benjamin Rd
- 2989 Harvey Ave
- 3051 Brower Ave
- 2999 Brower Ave
- 2995 Harvey Ave
Your Personal Tour Guide
Ask me questions while you tour the home.