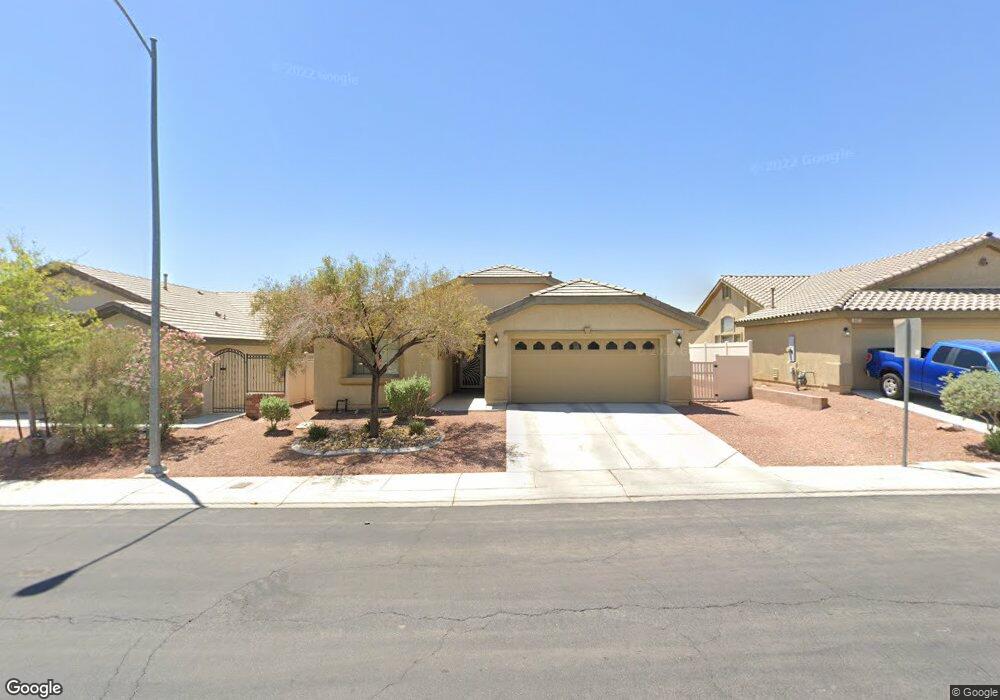
3025 Bublin Bay Ave Unit 2D North Las Vegas, NV 89081
Northridge NeighborhoodEstimated Value: $432,000 - $446,000
3
Beds
2
Baths
1,650
Sq Ft
$267/Sq Ft
Est. Value
About This Home
This home is located at 3025 Bublin Bay Ave Unit 2D, North Las Vegas, NV 89081 and is currently estimated at $439,882, approximately $266 per square foot. 3025 Bublin Bay Ave Unit 2D is a home located in Clark County with nearby schools including John Tartan Elementary School, Clifford O. Findlay Middle School, and Mojave High School.
Ownership History
Date
Name
Owned For
Owner Type
Purchase Details
Closed on
Nov 22, 2010
Sold by
Stone Ray K and Stone Barbara J
Bought by
Randall Gregory S
Current Estimated Value
Home Financials for this Owner
Home Financials are based on the most recent Mortgage that was taken out on this home.
Original Mortgage
$139,374
Outstanding Balance
$92,564
Interest Rate
4.4%
Mortgage Type
FHA
Estimated Equity
$347,318
Purchase Details
Closed on
Aug 21, 2007
Sold by
Centex Homes
Bought by
Stone Ray K and Stone Barbara J
Home Financials for this Owner
Home Financials are based on the most recent Mortgage that was taken out on this home.
Original Mortgage
$209,064
Interest Rate
6.73%
Mortgage Type
New Conventional
Create a Home Valuation Report for This Property
The Home Valuation Report is an in-depth analysis detailing your home's value as well as a comparison with similar homes in the area
Home Values in the Area
Average Home Value in this Area
Purchase History
| Date | Buyer | Sale Price | Title Company |
|---|---|---|---|
| Randall Gregory S | $143,000 | Nevada Title Las Vegas | |
| Stone Ray K | $261,330 | Commerce Title |
Source: Public Records
Mortgage History
| Date | Status | Borrower | Loan Amount |
|---|---|---|---|
| Open | Randall Gregory S | $139,374 | |
| Previous Owner | Stone Ray K | $209,064 |
Source: Public Records
Tax History Compared to Growth
Tax History
| Year | Tax Paid | Tax Assessment Tax Assessment Total Assessment is a certain percentage of the fair market value that is determined by local assessors to be the total taxable value of land and additions on the property. | Land | Improvement |
|---|---|---|---|---|
| 2025 | $2,027 | $138,833 | $34,300 | $104,533 |
| 2024 | $1,969 | $138,833 | $34,300 | $104,533 |
| 2023 | $1,588 | $131,277 | $33,250 | $98,027 |
| 2022 | $1,911 | $115,852 | $26,250 | $89,602 |
| 2021 | $1,856 | $109,229 | $24,150 | $85,079 |
| 2020 | $1,799 | $108,151 | $24,150 | $84,001 |
| 2019 | $1,777 | $102,649 | $20,300 | $82,349 |
| 2018 | $1,695 | $82,563 | $15,750 | $66,813 |
| 2017 | $2,518 | $75,063 | $14,700 | $60,363 |
| 2016 | $1,588 | $64,876 | $11,550 | $53,326 |
| 2015 | $1,584 | $58,125 | $8,750 | $49,375 |
| 2014 | $1,538 | $44,475 | $5,950 | $38,525 |
Source: Public Records
Map
Nearby Homes
- 3032 Prairie Princess Ave
- 3112 Blush Noisette Ave
- 3156 Mclennan Ave
- 5733 Awakening St
- 6040 Eganridge Ct
- 2904 River Ranch Place
- 2916 Kildare Cove Ct
- 5828 Autumn Damask St
- 3405 Brook Song Ave
- 3217 Aspinwall Ct
- 2771 Alderly Ridge Ave
- 3208 Aspinwall Ct
- 6120 Alderley Ct
- 3425 Palatine Hills Ave
- 2813 White Peaks Ave
- 2650 Dahlia Falls Ave Unit 126
- 2646 Dahlia Falls Ave
- 2646 Dahlia Falls Ave Unit 125
- 2608 Campobello Ave
- 1865 Plan at Kalea Bay
- 3021 Bublin Bay Ave
- 5920 Pearlie May Ct
- 3017 Bublin Bay Ave
- 3033 Bublin Bay Ave
- 5921 Pearlie May Ct
- 3024 Bublin Bay Ave
- 3037 Bublin Bay Ave
- 3020 Bublin Bay Ave
- 5928 Baronne Prevost St
- 5916 Pearlie May Ct
- 5917 Felicia Ct
- 5924 Baronne Prevost St
- 3016 Bublin Bay Ave
- 3032 Bublin Bay Ave
- 5917 Pearlie May Ct
- 5920 Baronne Prevost St
- 3012 Bublin Bay Ave
- 3036 Bublin Bay Ave
- 5913 Felicia Ct