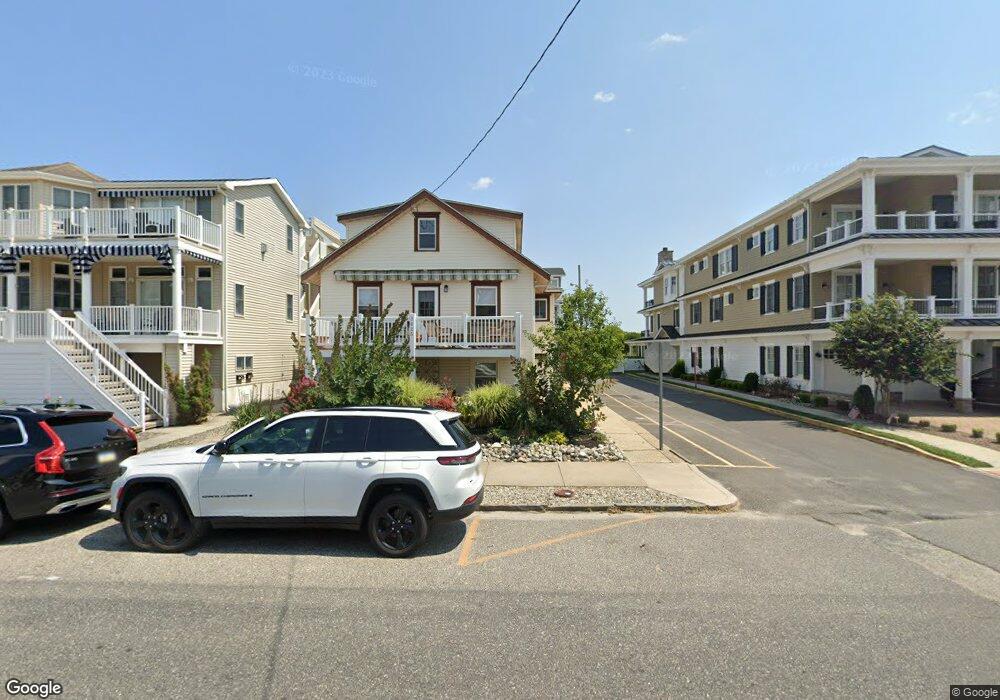
3025 Central Ave Ocean City, NJ 08226
Estimated Value: $1,419,000 - $3,674,000
--
Bed
--
Bath
3,154
Sq Ft
$741/Sq Ft
Est. Value
About This Home
This home is located at 3025 Central Ave, Ocean City, NJ 08226 and is currently estimated at $2,338,250, approximately $741 per square foot. 3025 Central Ave is a home located in Cape May County with nearby schools including Ocean City Primary School, Ocean City Intermediate School, and Ocean City High School.
Ownership History
Date
Name
Owned For
Owner Type
Purchase Details
Closed on
Nov 29, 2013
Sold by
John O Neill and Dougherty Henry
Bought by
The Odd Company Oneill/Dougherty/Dougher
Current Estimated Value
Purchase Details
Closed on
Nov 6, 2013
Sold by
John O Neill and Dougherty Henry
Bought by
John O Neill and Dougherty Henry
Purchase Details
Closed on
May 19, 2008
Sold by
Dougherty Daniel J
Bought by
Dougherty Daniel and The Daniel Dougherty Revocable
Purchase Details
Closed on
Mar 15, 2002
Sold by
O'Donnell Patrick J
Bought by
Cardillo Brian J and Cardillo Robin Lee
Home Financials for this Owner
Home Financials are based on the most recent Mortgage that was taken out on this home.
Original Mortgage
$250,000
Outstanding Balance
$103,329
Interest Rate
6.91%
Estimated Equity
$2,234,921
Create a Home Valuation Report for This Property
The Home Valuation Report is an in-depth analysis detailing your home's value as well as a comparison with similar homes in the area
Home Values in the Area
Average Home Value in this Area
Purchase History
| Date | Buyer | Sale Price | Title Company |
|---|---|---|---|
| The Odd Company Oneill/Dougherty/Dougher | -- | None Available | |
| John O Neill | -- | None Available | |
| Dougherty Daniel | -- | None Available | |
| Cardillo Brian J | $340,000 | -- |
Source: Public Records
Mortgage History
| Date | Status | Borrower | Loan Amount |
|---|---|---|---|
| Open | Cardillo Brian J | $250,000 |
Source: Public Records
Tax History Compared to Growth
Tax History
| Year | Tax Paid | Tax Assessment Tax Assessment Total Assessment is a certain percentage of the fair market value that is determined by local assessors to be the total taxable value of land and additions on the property. | Land | Improvement |
|---|---|---|---|---|
| 2025 | $8,646 | $770,600 | $724,000 | $46,600 |
| 2024 | $8,646 | $770,600 | $724,000 | $46,600 |
| 2023 | $8,253 | $770,600 | $724,000 | $46,600 |
| 2022 | $7,929 | $770,600 | $724,000 | $46,600 |
| 2021 | $5,749 | $770,600 | $724,000 | $46,600 |
| 2020 | $7,536 | $770,600 | $724,000 | $46,600 |
| 2019 | $7,452 | $770,600 | $724,000 | $46,600 |
| 2018 | $7,382 | $770,600 | $724,000 | $46,600 |
| 2017 | $7,267 | $770,600 | $724,000 | $46,600 |
| 2016 | $6,989 | $770,600 | $724,000 | $46,600 |
| 2015 | $6,897 | $770,600 | $724,000 | $46,600 |
| 2014 | $6,797 | $768,500 | $724,000 | $44,500 |
Source: Public Records
Map
Nearby Homes
- 3113 Central Ave Unit 3N
- 3122 Asbury Ave Unit 2nd
- 2924 Wesley Ave Unit 26
- 3039 Haven Ave Unit 2
- 3109 Central Ave Unit 1
- 2904 Haven Ave
- 2821 Central Ave Unit First floor
- 2820 Wesley Ave Unit 1st floor
- 2825 Haven Ave Unit 27
- 2825 -27 Haven Ave
- 2800 Central Ave Unit 1
- 3108 Bay Ave
- 2728 Central Ave Unit 1st floor
- 3300 Wesley Ave Unit 1
- 3316 Asbury Ave Unit 1
- 3314 West Ave Unit 2
- 3338 Asbury Ave Unit 1
- 3338-40 Asbury Ave
- 3340 Asbury Ave Unit 2
- 2703 Wesley Ave Unit 1st Floor
- 3021 Central Ave Unit 1ST FLOOR
- 3021 Central Ave Unit 23
- 3021 Central Ave Unit 23
- 3017 Central Ave Unit 1
- 3017 Central Ave Unit 1st Floor
- 3017 Central Ave Unit 19
- 3017 Central Ave Unit 19
- 3020 Wesley Ave Unit 22
- 3026 Central Ave Unit B
- 3013 Central Ave Unit 15
- 3013 Central Ave Unit 15
- 3038 Central Ave
- 3035 Central Ave Unit Second Floor
- 3023 Central Ave Unit 2
- 3023 Central Ave Unit 3023
- 3031 Central Ave
- 3031 Central Ave Unit Second Floor
- 3006 Wesley Ave Unit 2nd Floor
- 3006 Wesley Ave Unit 2
- 3014 Wesley Ave Unit 2nd Floor