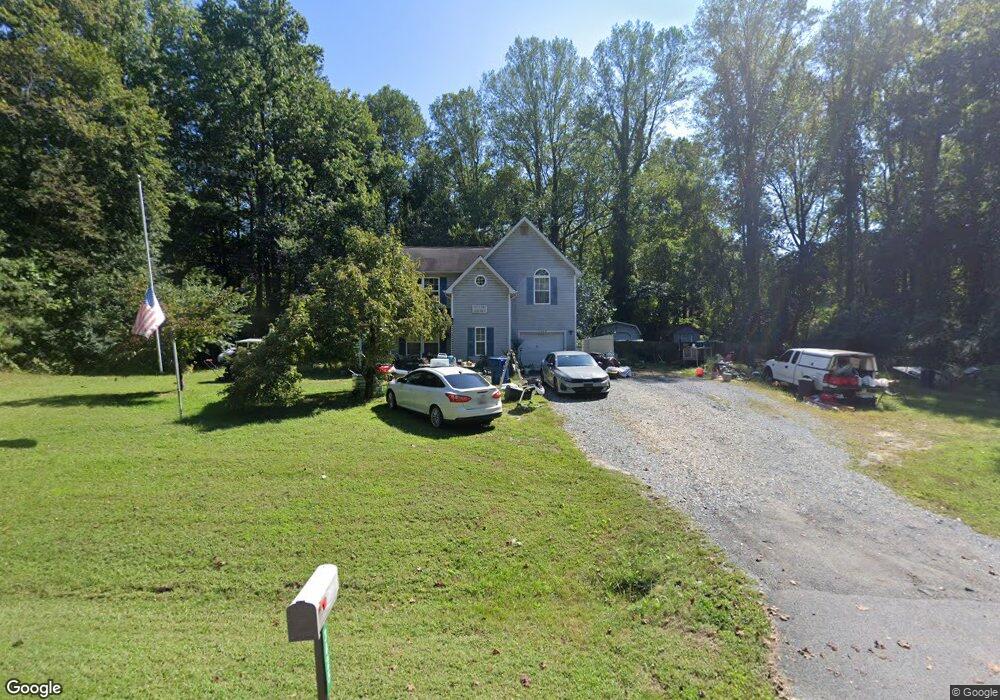
3025 Mandela Ct Port Republic, MD 20676
Port Republic NeighborhoodEstimated Value: $377,000 - $437,818
--
Bed
3
Baths
1,604
Sq Ft
$253/Sq Ft
Est. Value
About This Home
This home is located at 3025 Mandela Ct, Port Republic, MD 20676 and is currently estimated at $406,205, approximately $253 per square foot. 3025 Mandela Ct is a home located in Calvert County with nearby schools including Barstow Elementary School, Calvert Middle School, and Calvert High School.
Ownership History
Date
Name
Owned For
Owner Type
Purchase Details
Closed on
Jun 5, 2018
Sold by
Sesso George A and Sesso Nola A
Bought by
Sesso George A
Current Estimated Value
Home Financials for this Owner
Home Financials are based on the most recent Mortgage that was taken out on this home.
Original Mortgage
$200,411
Interest Rate
4.5%
Mortgage Type
FHA
Purchase Details
Closed on
May 3, 2002
Sold by
Hurysh Nicholas L
Bought by
Sesso George A and Sesso Nola A
Purchase Details
Closed on
Aug 8, 1996
Sold by
Johns Elaine Merski
Bought by
Hurysh Nicholas L
Purchase Details
Closed on
Aug 11, 1993
Sold by
Praley Edward A and Ford Mark E
Bought by
Johns Elaine Merski
Home Financials for this Owner
Home Financials are based on the most recent Mortgage that was taken out on this home.
Original Mortgage
$140,600
Interest Rate
7.21%
Create a Home Valuation Report for This Property
The Home Valuation Report is an in-depth analysis detailing your home's value as well as a comparison with similar homes in the area
Home Values in the Area
Average Home Value in this Area
Purchase History
| Date | Buyer | Sale Price | Title Company |
|---|---|---|---|
| Sesso George A | $224,000 | None Available | |
| Sesso George A | $159,900 | -- | |
| Hurysh Nicholas L | $139,000 | -- | |
| Johns Elaine Merski | $140,600 | -- |
Source: Public Records
Mortgage History
| Date | Status | Borrower | Loan Amount |
|---|---|---|---|
| Previous Owner | Sesso George A | $200,411 | |
| Previous Owner | Johns Elaine Merski | $140,600 | |
| Closed | Sesso George A | -- |
Source: Public Records
Tax History Compared to Growth
Tax History
| Year | Tax Paid | Tax Assessment Tax Assessment Total Assessment is a certain percentage of the fair market value that is determined by local assessors to be the total taxable value of land and additions on the property. | Land | Improvement |
|---|---|---|---|---|
| 2025 | $3,600 | $326,400 | $0 | $0 |
| 2024 | $3,600 | $313,500 | $151,300 | $162,200 |
| 2023 | $3,361 | $302,867 | $0 | $0 |
| 2022 | $3,247 | $292,233 | $0 | $0 |
| 2021 | $3,109 | $281,600 | $151,300 | $130,300 |
| 2020 | $3,109 | $278,133 | $0 | $0 |
| 2019 | $3,083 | $274,667 | $0 | $0 |
| 2018 | $3,034 | $271,200 | $151,300 | $119,900 |
| 2017 | $2,984 | $262,967 | $0 | $0 |
| 2016 | -- | $254,733 | $0 | $0 |
| 2015 | $3,114 | $246,500 | $0 | $0 |
| 2014 | $3,114 | $246,500 | $0 | $0 |
Source: Public Records
Map
Nearby Homes
- 1928 Elm Rd
- 1525 Sharpes Ct
- 3005 Blackberry Ln
- 2836 Allspice Rd
- 3199 Broomes Island Rd
- 118 Kinsey Dr
- 2409 Senate Ct
- 126 Kinsey Dr
- 105 Kinsey Dr
- 130 Kinsey Dr
- 134 Kinsey Dr
- 2011 North Ave
- 2412 Comptrollers Ct
- 56 Goldstein Rd
- 50 Goldstein Rd
- 2683 Sequoia Way
- 3325 First St
- 4551 Dares Beach Rd
- 2920 Dares Beach Rd
- 1975 Dares Beach Rd
- 3030 Mandela Ct
- 1816 Parkers Creek Rd
- 3035 Mandela Ct
- 1800 Parkers Creek Rd
- 1822 Parkers Creek Rd
- 1828 Parkers Creek Rd
- 1810 Parkers Creek Rd
- 3010 Mandela Ct
- 1790 Parkers Creek Rd
- 3050 Mandela Ct
- 3045 Mandela Ct
- 3040 Mandela Ct
- 1832 Parkers Creek Rd
- 1785 Parkers Creek Rd
- 1801 Parkers Creek Rd
- 1710 Parkers Creek Rd
- 1831 Parkers Creek Rd
- 3020 Bicentennial Ct
- 1840 Parkers Creek Rd
- 1765 Parkers Creek Rd