Estimated Value: $174,000 - $289,000
2
Beds
1
Bath
989
Sq Ft
$211/Sq Ft
Est. Value
About This Home
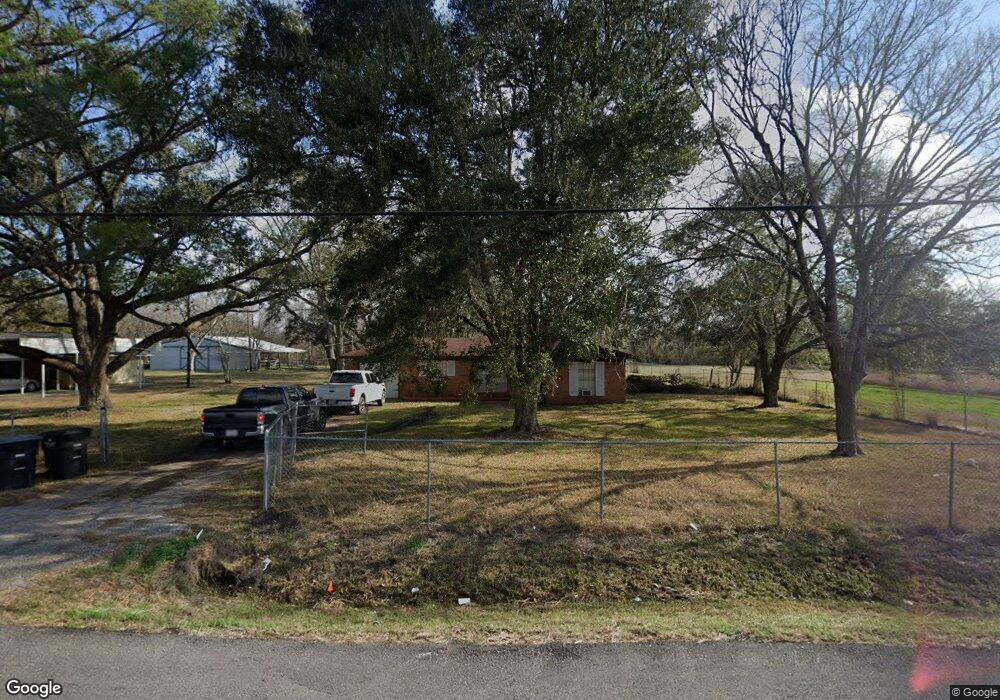
This home is located at 3025 Rowan Burton Rd, Alvin, TX 77511 and is currently estimated at $208,992, approximately $211 per square foot. 3025 Rowan Burton Rd is a home located in Brazoria County with nearby schools including Alvin Elementary School, Alvin Junior High School, and Alvin High School.
Ownership History
Date
Name
Owned For
Owner Type
Purchase Details
Closed on
Jun 12, 2020
Sold by
Tnegras Inc
Bought by
Bridges Lindsay Nicole
Current Estimated Value
Home Financials for this Owner
Home Financials are based on the most recent Mortgage that was taken out on this home.
Original Mortgage
$121,754
Outstanding Balance
$107,926
Interest Rate
3.2%
Mortgage Type
FHA
Estimated Equity
$101,066
Purchase Details
Closed on
Aug 22, 2012
Sold by
Davis Jean
Bought by
Tnegras Inc
Purchase Details
Closed on
Jul 12, 2012
Sold by
Cooper Gary Austin and The Austin Foundation Trust
Bought by
Davis Jean
Purchase Details
Closed on
Dec 7, 2009
Sold by
Morgan Foundation Trust
Bought by
Austin Foundation Trust
Purchase Details
Closed on
May 1, 2009
Sold by
Delsontro Ricky N
Bought by
Morgan Foundation Trust
Create a Home Valuation Report for This Property
The Home Valuation Report is an in-depth analysis detailing your home's value as well as a comparison with similar homes in the area
Home Values in the Area
Average Home Value in this Area
Purchase History
| Date | Buyer | Sale Price | Title Company |
|---|---|---|---|
| Bridges Lindsay Nicole | -- | Fidelity National Title | |
| Tnegras Inc | -- | None Available | |
| Davis Jean | $25,000 | None Available | |
| Austin Foundation Trust | -- | None Available | |
| Morgan Foundation Trust | $80,000 | None Available |
Source: Public Records
Mortgage History
| Date | Status | Borrower | Loan Amount |
|---|---|---|---|
| Open | Bridges Lindsay Nicole | $121,754 |
Source: Public Records
Tax History Compared to Growth
Tax History
| Year | Tax Paid | Tax Assessment Tax Assessment Total Assessment is a certain percentage of the fair market value that is determined by local assessors to be the total taxable value of land and additions on the property. | Land | Improvement |
|---|---|---|---|---|
| 2025 | $1,935 | $152,746 | $112,820 | $71,430 |
| 2023 | $1,935 | $151,162 | $77,470 | $126,650 |
| 2022 | $3,769 | $137,420 | $51,640 | $85,780 |
| 2021 | $3,836 | $132,880 | $61,970 | $70,910 |
| 2020 | $3,309 | $113,050 | $47,670 | $65,380 |
| 2019 | $3,498 | $116,450 | $43,700 | $72,750 |
| 2018 | $3,385 | $112,480 | $39,730 | $72,750 |
| 2017 | $2,873 | $94,290 | $39,730 | $54,560 |
| 2016 | $2,873 | $94,290 | $39,730 | $54,560 |
| 2014 | $2,911 | $93,670 | $39,730 | $53,940 |
Source: Public Records
Map
Nearby Homes
- 221 Magnolia Laurel Dr
- 239 Bay Laurel Ct
- 211 Orchard Laurel Dr
- 220 Magnolia Laurel Dr
- 204 Orchard Laurel Dr
- 243 Bay Laurel Ct
- 230 Magnolia Laurel Dr
- 3206 Deer Trail Dr
- 2609 Quail Run Dr
- 3401 Wood Fox Dr
- 1916 Tracy Lynn Ln
- 2408 Chelmsford Ct
- 2609 Adams St
- 2604 Adams St
- 2514 Westfield St
- 2306 Westfield St
- 2714 Westfield St
- 1902 Westview Dr
- 1237 Lancer Leap Dr
- 1217 Lancer Leap Dr
- 3005 Rowan Burton Rd
- 3030 Rowan Burton Rd
- 3035 Rowan Burton Rd
- 2960 Rowan Burton Rd
- 2955 Rowan Burton Rd Unit 178
- 2975 Rowan Burton Rd
- 3125 Rowan Burton Rd
- 3125 Rowan Burton Rd
- 2926 Rowan Burton Rd
- 2625 Ryan Dr
- 2925 Rowan Burton Rd
- 2595 Ryan Dr
- 2575 Ryan Dr
- 2901 Quail Run Dr
- 2903 Quail Run Dr
- 2905 Quail Run Dr
- 3175 Rowan Burton Rd
- 2745 Rowan Burton Rd
- 2725 Rowan Burton Rd Unit 178
- 3001 Quail Run Dr