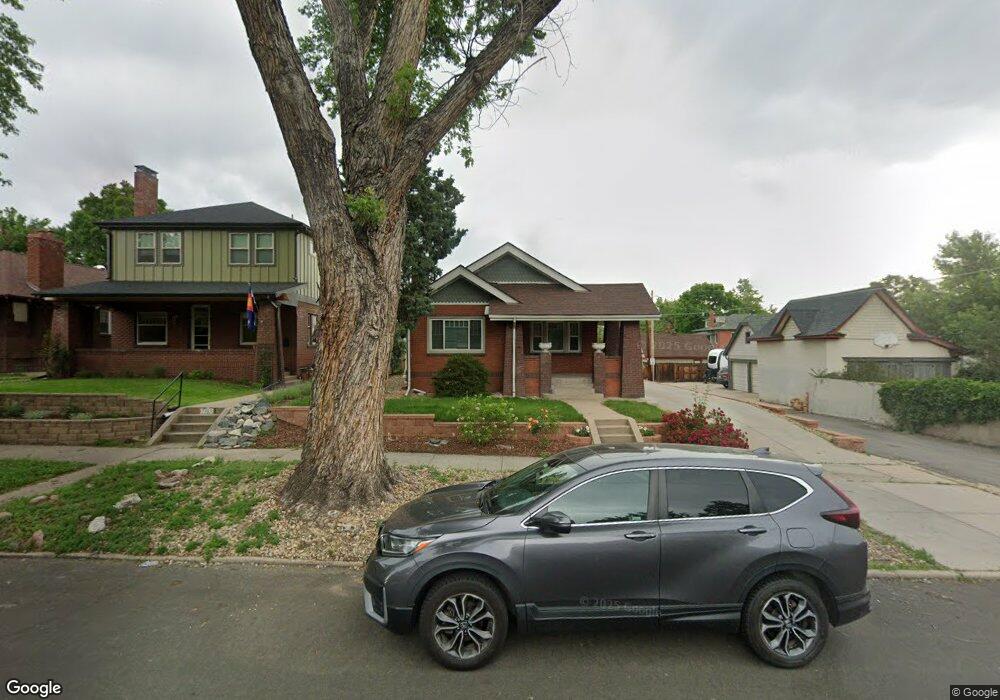
3025 W 35th Ave Denver, CO 80211
West Highland NeighborhoodEstimated Value: $742,000 - $794,000
2
Beds
1
Bath
1,507
Sq Ft
$511/Sq Ft
Est. Value
About This Home
This home is located at 3025 W 35th Ave, Denver, CO 80211 and is currently estimated at $770,180, approximately $511 per square foot. 3025 W 35th Ave is a home located in Denver County with nearby schools including Edison Elementary School, Bryant Webster Dual Language School, and Skinner Middle School.
Ownership History
Date
Name
Owned For
Owner Type
Purchase Details
Closed on
Jun 1, 2021
Sold by
Crocker Sara C and Schneider Andrew M
Bought by
Crisman Shelby
Current Estimated Value
Home Financials for this Owner
Home Financials are based on the most recent Mortgage that was taken out on this home.
Original Mortgage
$596,850
Outstanding Balance
$540,373
Interest Rate
2.9%
Mortgage Type
New Conventional
Estimated Equity
$229,807
Purchase Details
Closed on
Sep 29, 2009
Sold by
Subia David F
Bought by
Crocker Sara C and Schneider Andrew M
Home Financials for this Owner
Home Financials are based on the most recent Mortgage that was taken out on this home.
Original Mortgage
$275,182
Interest Rate
5.12%
Mortgage Type
FHA
Purchase Details
Closed on
May 31, 2002
Sold by
Loza John P
Bought by
Subia David F
Home Financials for this Owner
Home Financials are based on the most recent Mortgage that was taken out on this home.
Original Mortgage
$142,759
Interest Rate
6.89%
Mortgage Type
FHA
Create a Home Valuation Report for This Property
The Home Valuation Report is an in-depth analysis detailing your home's value as well as a comparison with similar homes in the area
Home Values in the Area
Average Home Value in this Area
Purchase History
| Date | Buyer | Sale Price | Title Company |
|---|---|---|---|
| Crisman Shelby | $690,000 | Signloc Title & Escrow | |
| Crocker Sara C | $283,000 | Security Title | |
| Subia David F | $145,000 | North American Title Co |
Source: Public Records
Mortgage History
| Date | Status | Borrower | Loan Amount |
|---|---|---|---|
| Open | Crisman Shelby | $596,850 | |
| Previous Owner | Crocker Sara C | $275,182 | |
| Previous Owner | Subia David F | $142,759 |
Source: Public Records
Tax History Compared to Growth
Tax History
| Year | Tax Paid | Tax Assessment Tax Assessment Total Assessment is a certain percentage of the fair market value that is determined by local assessors to be the total taxable value of land and additions on the property. | Land | Improvement |
|---|---|---|---|---|
| 2024 | $4,092 | $51,670 | $37,410 | $14,260 |
| 2023 | $4,004 | $51,670 | $37,410 | $14,260 |
| 2022 | $3,070 | $38,600 | $32,940 | $5,660 |
| 2021 | $3,070 | $39,700 | $33,880 | $5,820 |
| 2020 | $2,798 | $37,710 | $33,880 | $3,830 |
| 2019 | $2,719 | $37,710 | $33,880 | $3,830 |
| 2018 | $2,455 | $31,730 | $24,080 | $7,650 |
| 2017 | $2,447 | $31,730 | $24,080 | $7,650 |
| 2016 | $2,394 | $29,360 | $25,520 | $3,840 |
| 2015 | $2,294 | $29,360 | $25,520 | $3,840 |
| 2014 | $2,177 | $26,210 | $17,401 | $8,809 |
Source: Public Records
Map
Nearby Homes
- 3055 W 36th Ave
- 3725 Federal Blvd
- 3639 Eliot St
- 3159 W 36th Ave
- 2845 W 36th Ave
- 2929 W 37th Ave
- 3249 W Fairview Place Unit 106
- 3249 W Fairview Place Unit 111
- 3130 W 38th Ave Unit 4
- 3116 W 32nd Ave
- 3334 W 37th Ave
- 2727 W 34th Ave
- 3411-3429 W 38th Ave
- 3050 W 32nd Ave Unit 102C
- 3050 W 32nd Ave Unit 202C
- 3445 Clay St
- 3361 W 36th Ave
- 2952 W Denver Place
- 2830 W 32nd Ave
- 2900 W 32nd Ave
- 3035 W 35th Ave
- 3043 W 35th Ave
- 3049 W 35th Ave
- 3501 Federal Blvd
- 3519 Federal Blvd
- 3024 W 36th Ave
- 3525 Federal Blvd
- 3034 W 35th Ave
- 3030 W 35th Ave
- 3038 W 35th Ave
- 3034 W 36th Ave
- 3057 W 35th Ave
- 3040 W 36th Ave
- 3529 Federal Blvd
- 3046 W 36th Ave
- 3046 W 35th Ave
- 3457 Federal Blvd
- 3050 W 36th Ave
- 3555 Federal Blvd
- 3065 W 35th Ave