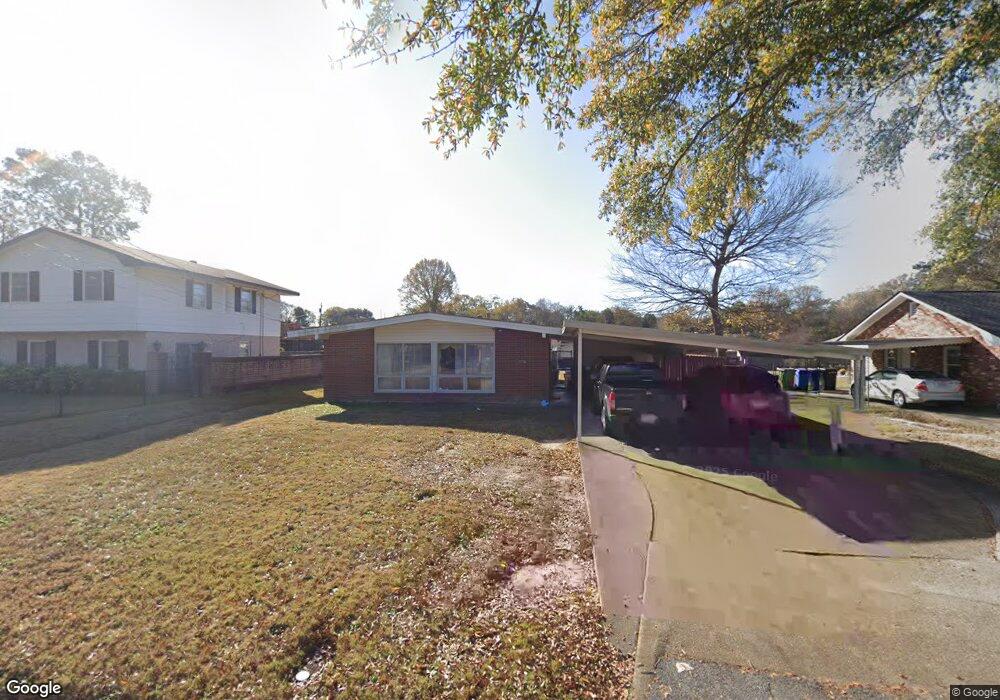
3026 Avondale Rd Columbus, GA 31903
Southern Columbus NeighborhoodEstimated Value: $92,000 - $145,000
3
Beds
3
Baths
1,421
Sq Ft
$79/Sq Ft
Est. Value
About This Home
This home is located at 3026 Avondale Rd, Columbus, GA 31903 and is currently estimated at $112,732, approximately $79 per square foot. 3026 Avondale Rd is a home located in Muscogee County with nearby schools including South Columbus Elementary School, Eddy Middle School, and Spencer High School.
Ownership History
Date
Name
Owned For
Owner Type
Purchase Details
Closed on
Aug 29, 2025
Sold by
Family Snowball Llc
Bought by
Farrell Michael
Current Estimated Value
Home Financials for this Owner
Home Financials are based on the most recent Mortgage that was taken out on this home.
Original Mortgage
$143,200
Outstanding Balance
$143,200
Interest Rate
6.74%
Mortgage Type
New Conventional
Estimated Equity
-$30,468
Purchase Details
Closed on
May 30, 2025
Sold by
Hollis Judy E and Edwards Roberta L
Bought by
Family Snowball Llc
Home Financials for this Owner
Home Financials are based on the most recent Mortgage that was taken out on this home.
Original Mortgage
$115,000
Interest Rate
6.81%
Mortgage Type
Construction
Purchase Details
Closed on
May 20, 2014
Sold by
Warren Erna J
Bought by
Hollis Judy E and Warren Brenda J
Create a Home Valuation Report for This Property
The Home Valuation Report is an in-depth analysis detailing your home's value as well as a comparison with similar homes in the area
Home Values in the Area
Average Home Value in this Area
Purchase History
| Date | Buyer | Sale Price | Title Company |
|---|---|---|---|
| Farrell Michael | $179,000 | None Listed On Document | |
| Farrell Michael | $179,000 | None Listed On Document | |
| Family Snowball Llc | $70,000 | None Listed On Document | |
| Hollis Judy E | -- | -- | |
| Hollis Judy E | -- | -- |
Source: Public Records
Mortgage History
| Date | Status | Borrower | Loan Amount |
|---|---|---|---|
| Open | Farrell Michael | $143,200 | |
| Closed | Farrell Michael | $143,200 | |
| Previous Owner | Family Snowball Llc | $115,000 |
Source: Public Records
Tax History Compared to Growth
Tax History
| Year | Tax Paid | Tax Assessment Tax Assessment Total Assessment is a certain percentage of the fair market value that is determined by local assessors to be the total taxable value of land and additions on the property. | Land | Improvement |
|---|---|---|---|---|
| 2025 | $1,493 | $38,152 | $4,252 | $33,900 |
| 2024 | $1,493 | $38,152 | $4,252 | $33,900 |
| 2023 | $1,503 | $38,152 | $4,252 | $33,900 |
| 2022 | $1,062 | $26,012 | $4,252 | $21,760 |
| 2021 | $1,159 | $28,392 | $4,252 | $24,140 |
| 2020 | $1,160 | $28,392 | $4,252 | $24,140 |
| 2019 | $1,163 | $28,392 | $4,252 | $24,140 |
| 2018 | $1,163 | $28,392 | $4,252 | $24,140 |
| 2017 | $1,167 | $28,392 | $4,252 | $24,140 |
| 2016 | $1,152 | $27,926 | $3,450 | $24,476 |
| 2015 | $461 | $27,926 | $3,450 | $24,476 |
| 2014 | $243 | $27,926 | $3,450 | $24,476 |
| 2013 | -- | $27,926 | $3,450 | $24,476 |
Source: Public Records
Map
Nearby Homes
- 2973 Hawthorne Dr
- 2451 Brownie Ln
- 1274 Providence Ln
- 2463 Brownie Ln
- 3009 Plantation Rd
- 2102 Somerset Ave
- 2463 Brownie St
- 3042 Colonial Dr
- 2203 Simmons Ave
- 3015 Hendrix St
- 3135 Baker Cir
- 2333 Bruce Ave
- 2353 Shelby St
- 1029 Harbison Dr
- 2404 Bruce Ave
- 3310 Albert St
- 7 Esquiline Dr
- 37 Muscogee Dr
- 15 Lowe Dr
- 13 Esquiline Dr
- 3030 Avondale Rd
- 3022 Avondale Rd
- 3029 Emory St
- 1811 Somerset Ave
- 3025 Emory St
- 3018 Avondale Rd
- 3025 Avondale Rd
- 3029 Avondale Rd
- 3021 Avondale Rd
- 3031 Avondale Rd
- 3034 Avondale Rd
- 3014 Avondale Rd
- 1806 Somerset Ave
- 3017 Avondale Rd
- 3017 Emory St
- 3035 Avondale Rd
- 1812 Somerset Ave
- 3013 Avondale Rd
- 3010 Avondale Rd
- 1818 Somerset Ave