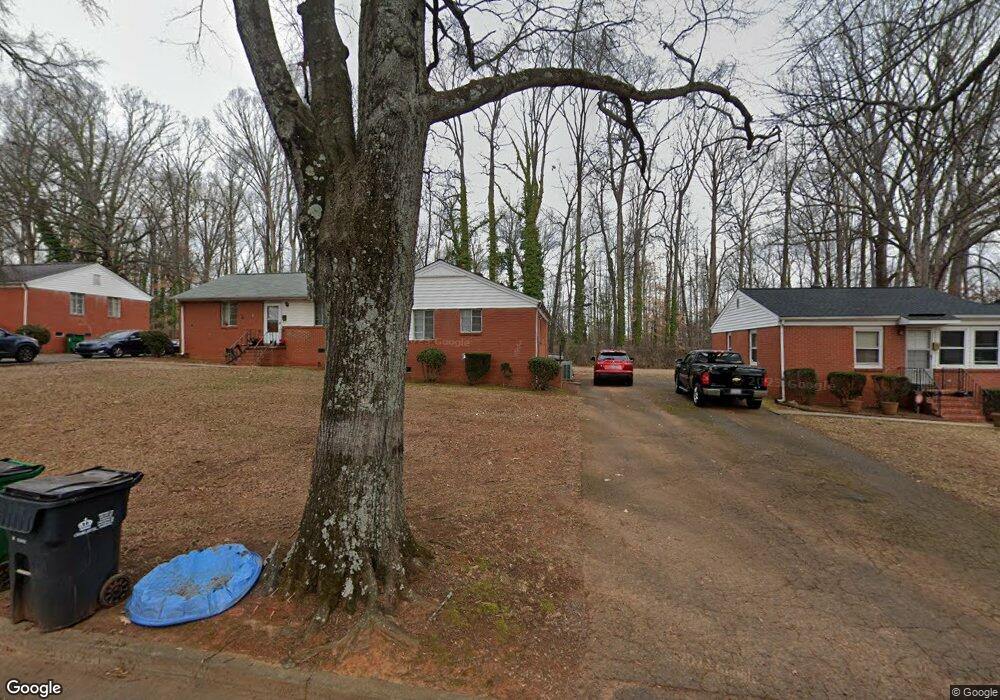
3026 Marlborough Rd Unit 3026 Charlotte, NC 28208
Ashley Park NeighborhoodEstimated Value: $136,000 - $193,000
3
Beds
1
Bath
875
Sq Ft
$181/Sq Ft
Est. Value
About This Home
This home is located at 3026 Marlborough Rd Unit 3026, Charlotte, NC 28208 and is currently estimated at $158,670, approximately $181 per square foot. 3026 Marlborough Rd Unit 3026 is a home located in Mecklenburg County with nearby schools including Ashley Park Elementary School, West Charlotte High School, and Movement School.
Ownership History
Date
Name
Owned For
Owner Type
Purchase Details
Closed on
Mar 11, 2016
Sold by
Ajmera Dimple and Ajmera Punita
Bought by
Panorama Real Estate Holdings Llc
Current Estimated Value
Purchase Details
Closed on
Aug 17, 2015
Sold by
Christina Trust
Bought by
Ajmera Dimple
Purchase Details
Closed on
Aug 3, 2015
Sold by
Christina Trust
Bought by
Ajmera Dimple
Purchase Details
Closed on
Jun 23, 2014
Sold by
Hector Robert
Bought by
Turst Christiana and Normandy Mortgage Loan Trust Series 2013
Purchase Details
Closed on
Sep 19, 2003
Sold by
Mw Group Llc
Bought by
Hector Robert
Home Financials for this Owner
Home Financials are based on the most recent Mortgage that was taken out on this home.
Original Mortgage
$69,031
Interest Rate
6.33%
Mortgage Type
FHA
Create a Home Valuation Report for This Property
The Home Valuation Report is an in-depth analysis detailing your home's value as well as a comparison with similar homes in the area
Home Values in the Area
Average Home Value in this Area
Purchase History
| Date | Buyer | Sale Price | Title Company |
|---|---|---|---|
| Panorama Real Estate Holdings Llc | -- | None Available | |
| Ajmera Punitha | -- | None Available | |
| Ajmera Dimple | $28,000 | None Available | |
| Ajmera Dimple | -- | None Available | |
| Ajmera Dimple | $28,000 | None Available | |
| Turst Christiana | $30,000 | None Available | |
| Hector Robert | $75,000 | -- |
Source: Public Records
Mortgage History
| Date | Status | Borrower | Loan Amount |
|---|---|---|---|
| Previous Owner | Hector Robert | $69,031 | |
| Closed | Hector Robert | $7,500 |
Source: Public Records
Tax History Compared to Growth
Tax History
| Year | Tax Paid | Tax Assessment Tax Assessment Total Assessment is a certain percentage of the fair market value that is determined by local assessors to be the total taxable value of land and additions on the property. | Land | Improvement |
|---|---|---|---|---|
| 2025 | -- | $113,933 | -- | $113,933 |
| 2024 | -- | $113,933 | -- | $113,933 |
| 2023 | $647 | $113,933 | $0 | $113,933 |
| 2022 | $647 | $67,000 | $0 | $67,000 |
| 2021 | $647 | $67,000 | $0 | $67,000 |
| 2020 | $647 | $67,000 | $0 | $67,000 |
| 2019 | $738 | $67,000 | $0 | $67,000 |
| 2018 | $836 | $58,100 | $14,000 | $44,100 |
| 2017 | $815 | $58,100 | $14,000 | $44,100 |
| 2016 | $806 | $58,100 | $14,000 | $44,100 |
| 2015 | $794 | $58,100 | $14,000 | $44,100 |
| 2014 | $785 | $58,100 | $14,000 | $44,100 |
Source: Public Records
Map
Nearby Homes
- 3014 Marlborough Rd
- 3210 Marlborough Rd Unit 3210
- 3122 Marlborough Rd Unit 3122
- 3125 Marlborough Rd
- 3109 Marlborough Rd
- 3233 Marlborough Rd Unit 3233
- 3103 Minnesota Rd Unit 3103
- 3225 Dannelly Towns Alley Unit 1002A
- 1413 Richardson Towns Ct Unit 1007C
- 2346 Orton St
- 2830 Royston Rd Unit 2
- 2243 Ashley Rd
- 2003 Ashley Rd
- 3251 Dannelly Towns Alley Unit 1003C
- 3154 Dublin Rd
- Spencer End Home Plan at Ashley Townhomes
- Spencer Plan at Ashley Townhomes
- 2525 Lumina Ave
- Alleghany/Ashley Alleghany St
- 2314 Westerly Hills Dr
- 2914 Marlborough Rd
- 2926 Marlborough Rd Unit 2926
- 3100 Marlborough Rd Unit 3100
- 3208 Marlborough Rd Unit 3208
- 3216 Marlborough Rd
- 3226 Marlborough Rd
- 1908 Manteo Ct Unit 1908
- 1916 Manteo Ct Unit 1916
- 3239 Minnesota Rd Unit 3239
- 3233 Minnesota Rd Unit 3233
- 3227 Minnesota Rd
- 3225 Minnesota Rd Unit 3225
- 3217 Minnesota Rd Unit 3217
- 3140 Marlborough Rd Unit 3140
- 3138 Marlborough Rd Unit 3138
- 3200 Marlborough Rd
- 3132 Marlborough Rd Unit 3132
- 3202 Marlborough Rd
- 3130 Marlborough Rd Unit 3130
- 3124 Marlborough Rd Unit 3122