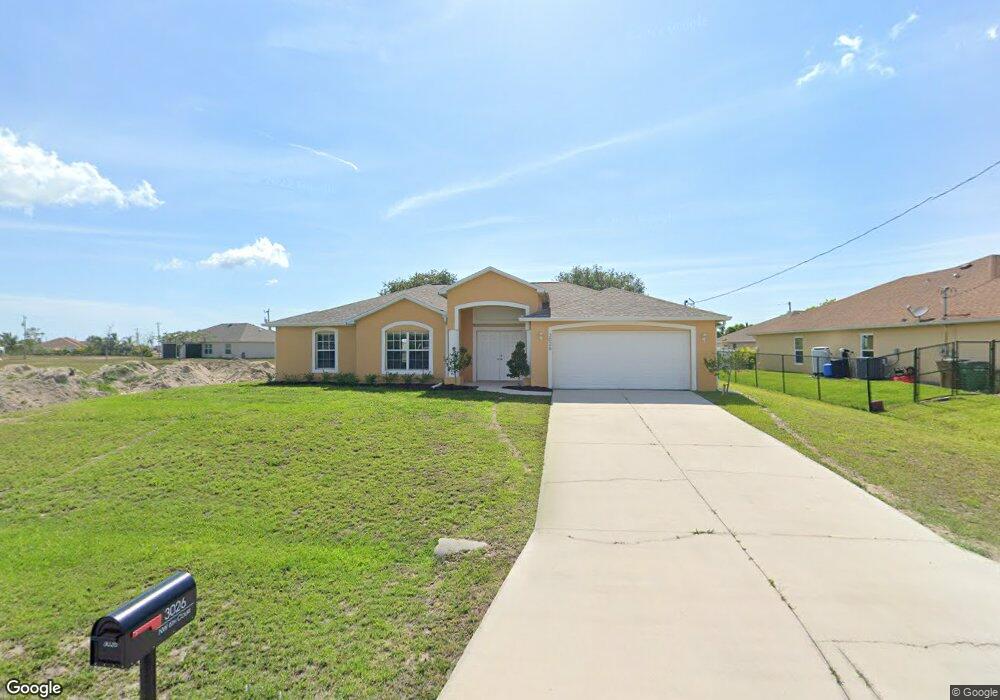
3026 NW 6th Ct Unit 40 Cape Coral, FL 33993
Mariner NeighborhoodEstimated Value: $296,927 - $366,000
3
Beds
2
Baths
2,179
Sq Ft
$155/Sq Ft
Est. Value
About This Home
This home is located at 3026 NW 6th Ct Unit 40, Cape Coral, FL 33993 and is currently estimated at $336,982, approximately $154 per square foot. 3026 NW 6th Ct Unit 40 is a home located in Lee County with nearby schools including Dr. Carrie D. Robinson Littleton Elementary School, Caloosa Elementary School, and Tropic Isles Elementary School.
Ownership History
Date
Name
Owned For
Owner Type
Purchase Details
Closed on
Nov 17, 2010
Sold by
Cape Coral 72 Llc
Bought by
Rehm David J
Current Estimated Value
Home Financials for this Owner
Home Financials are based on the most recent Mortgage that was taken out on this home.
Original Mortgage
$69,675
Outstanding Balance
$46,111
Interest Rate
4.33%
Mortgage Type
New Conventional
Estimated Equity
$290,871
Purchase Details
Closed on
May 30, 2008
Sold by
Jdc Florida Inc
Bought by
Cape Coral 72 Llc
Home Financials for this Owner
Home Financials are based on the most recent Mortgage that was taken out on this home.
Original Mortgage
$3,636,000
Interest Rate
6%
Mortgage Type
Unknown
Purchase Details
Closed on
Jun 2, 2005
Sold by
Gonzalez Osmir and Gonzalez Naida
Bought by
Jdc Of Florida Inc
Purchase Details
Closed on
Apr 7, 1999
Sold by
Clerk Of Circuit Court
Bought by
Cohen Jean
Create a Home Valuation Report for This Property
The Home Valuation Report is an in-depth analysis detailing your home's value as well as a comparison with similar homes in the area
Home Values in the Area
Average Home Value in this Area
Purchase History
| Date | Buyer | Sale Price | Title Company |
|---|---|---|---|
| Rehm David J | $92,900 | Title Professionals Of Fl | |
| Cape Coral 72 Llc | $7,310,600 | B&L Title Services Llc | |
| Jdc Of Florida Inc | $75,000 | Cape Coral Title Insurance A | |
| Cohen Jean | $500 | -- |
Source: Public Records
Mortgage History
| Date | Status | Borrower | Loan Amount |
|---|---|---|---|
| Open | Rehm David J | $69,675 | |
| Previous Owner | Cape Coral 72 Llc | $3,636,000 |
Source: Public Records
Tax History Compared to Growth
Tax History
| Year | Tax Paid | Tax Assessment Tax Assessment Total Assessment is a certain percentage of the fair market value that is determined by local assessors to be the total taxable value of land and additions on the property. | Land | Improvement |
|---|---|---|---|---|
| 2025 | $4,814 | $257,101 | $32,300 | $224,801 |
| 2024 | $4,811 | $240,737 | -- | -- |
| 2023 | $4,811 | $218,852 | $0 | $0 |
| 2022 | $4,207 | $198,956 | $0 | $0 |
| 2021 | $3,727 | $180,869 | $8,500 | $172,369 |
| 2020 | $3,620 | $168,766 | $8,800 | $159,966 |
| 2019 | $3,469 | $163,919 | $10,000 | $153,919 |
| 2018 | $3,360 | $165,529 | $10,000 | $155,529 |
| 2017 | $3,217 | $159,900 | $10,000 | $149,900 |
| 2016 | $2,943 | $141,570 | $10,000 | $131,570 |
| 2015 | $2,722 | $124,699 | $6,100 | $118,599 |
| 2014 | $2,537 | $116,692 | $6,016 | $110,676 |
| 2013 | -- | $107,097 | $4,100 | $102,997 |
Source: Public Records
Map
Nearby Homes
- 3039 NW 6th Ct
- 909 NW 30th St
- 632 Wilmington Pkwy
- 2929 NW 6th Place
- 3212 NW 5th Place
- 3012 NW 7th Place
- 520 Wilmington Pkwy
- 648 NW 29th Terrace
- 2909 NW 6th Ave
- 2936 NW 5th Place
- 629 Wilmington Pkwy
- 661 Wilmington Pkwy
- 637 Wilmington Pkwy
- 908 Wilmington Pkwy
- 531 Wilmington Pkwy
- 310 Wilmington Pkwy
- 719 Wilmington Pkwy Unit 3
- 907 Wilmington Pkwy Unit 6
- 901 Wilmington Pkwy Unit 9
- 904 Wilmington Pkwy Unit 3
- 3030 NW 6th Ct
- 3022 NW 6th Ct
- 3017 NW Douglas Cir
- 3018 NW 6th Ct
- 3013 NW Douglas Cir
- 3034 NW 6th Ct
- 3021 NW Douglas Cir
- 3029 NW 6th Ct
- 3009 NW Douglas Cir
- 3035 NW 6th Ct
- 3038 NW 6th Ct
- 3021 NW 6th Ct
- 3025 NW Douglas Cir
- 612 NW 30th Terrace
- 3010 NW Douglas Cir
- 623 NW Douglas Cir
- 3016 NW 6th Place
- 3012 NW 6th Place
- 3014 NW Douglas Cir
- 3020 NW 6th Place