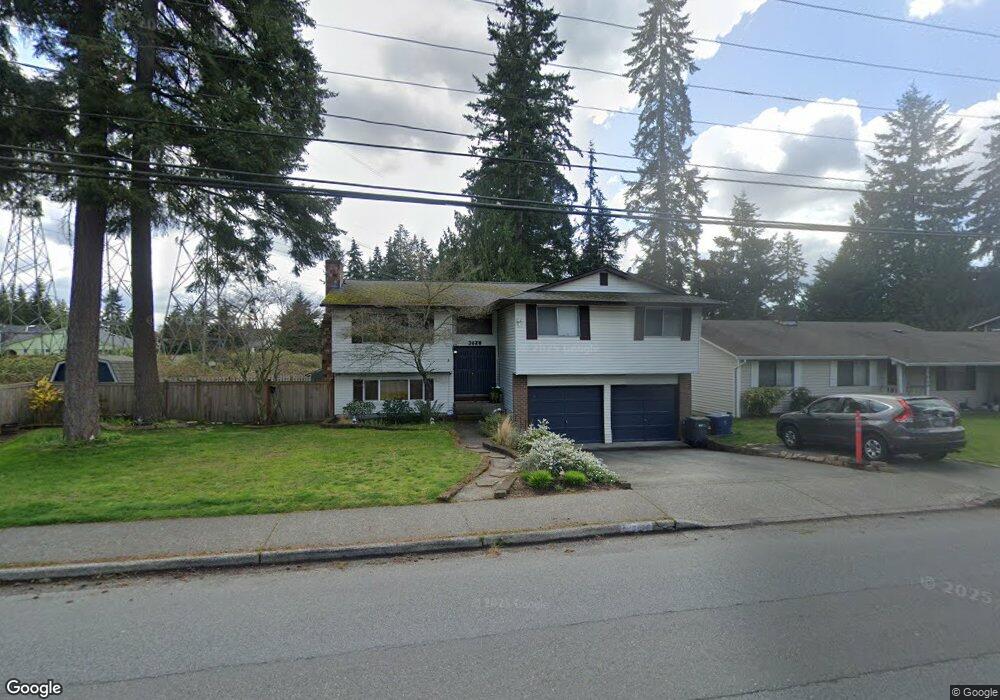
3028 168th St SE Bothell, WA 98012
North Creek NeighborhoodEstimated Value: $755,159 - $913,000
5
Beds
3
Baths
2,000
Sq Ft
$421/Sq Ft
Est. Value
About This Home
This home is located at 3028 168th St SE, Bothell, WA 98012 and is currently estimated at $841,790, approximately $420 per square foot. 3028 168th St SE is a home located in Snohomish County with nearby schools including Cedar Wood Elementary School, Heatherwood Middle School, and Henry M. Jackson High School.
Ownership History
Date
Name
Owned For
Owner Type
Purchase Details
Closed on
Sep 14, 2005
Sold by
Body Mark S and Body Christine A
Bought by
Pebles James P and Pagano Krystal
Current Estimated Value
Home Financials for this Owner
Home Financials are based on the most recent Mortgage that was taken out on this home.
Original Mortgage
$258,360
Outstanding Balance
$132,281
Interest Rate
5.76%
Mortgage Type
Stand Alone First
Estimated Equity
$709,509
Purchase Details
Closed on
Feb 22, 2000
Sold by
Bruckner Brian M and Bruckner Cindy S
Bought by
Body Mark S and Body Christine A
Home Financials for this Owner
Home Financials are based on the most recent Mortgage that was taken out on this home.
Original Mortgage
$178,400
Interest Rate
9.62%
Purchase Details
Closed on
Jul 21, 1995
Sold by
Payne Gary F and Payne Gary P
Bought by
Bruckner Brian M and Bruckner Cindy S
Home Financials for this Owner
Home Financials are based on the most recent Mortgage that was taken out on this home.
Original Mortgage
$144,400
Interest Rate
7.62%
Create a Home Valuation Report for This Property
The Home Valuation Report is an in-depth analysis detailing your home's value as well as a comparison with similar homes in the area
Home Values in the Area
Average Home Value in this Area
Purchase History
| Date | Buyer | Sale Price | Title Company |
|---|---|---|---|
| Pebles James P | $322,950 | Pnwt | |
| Body Mark S | $223,000 | Chicago Title Insurance Co | |
| Bruckner Brian M | $152,000 | Transamerica Title Ins Co |
Source: Public Records
Mortgage History
| Date | Status | Borrower | Loan Amount |
|---|---|---|---|
| Open | Pebles James P | $258,360 | |
| Previous Owner | Body Mark S | $178,400 | |
| Previous Owner | Bruckner Brian M | $144,400 | |
| Closed | Body Mark S | $44,600 |
Source: Public Records
Tax History
| Year | Tax Paid | Tax Assessment Tax Assessment Total Assessment is a certain percentage of the fair market value that is determined by local assessors to be the total taxable value of land and additions on the property. | Land | Improvement |
|---|---|---|---|---|
| 2026 | $6,708 | $733,200 | $457,900 | $275,300 |
| 2025 | $6,220 | $692,500 | $427,700 | $264,800 |
| 2024 | $6,220 | $644,600 | $388,800 | $255,800 |
| 2023 | $6,535 | $743,200 | $448,900 | $294,300 |
| 2022 | $5,686 | $559,300 | $306,900 | $252,400 |
| 2020 | $5,719 | $473,300 | $253,600 | $219,700 |
| 2019 | $5,351 | $444,000 | $229,700 | $214,300 |
| 2018 | $5,169 | $390,600 | $198,800 | $191,800 |
| 2017 | $4,509 | $342,600 | $165,200 | $177,400 |
| 2016 | $4,018 | $320,500 | $148,000 | $172,500 |
| 2015 | $3,985 | $301,400 | $144,400 | $157,000 |
| 2013 | $3,449 | $230,200 | $120,000 | $110,200 |
Source: Public Records
Map
Nearby Homes
- 17001 31st Dr SE
- 17715 2nd Ave W
- 16606 35th Ave SE Unit 9A
- 17116 35th Dr SE Unit C6
- 17116 35th Dr SE Unit C2
- 17116 35th Dr SE Unit A2
- 2502 166th Place SE
- 3701 170th Place SE
- 16116 35th Park SE
- 16519 37th Dr SE
- 3414 176th Place SE
- 4003 168th Place SE
- 3620 159th Place SE
- 17321 40th Ave SE
- 3205 179th Place SE
- 17529 Brook Blvd
- 3918 177th St SE
- 1815 172nd St SE
- 2127 159th Ct SE
- 3621 156th Place SE
- 3020 168th St SE
- 16727 30th Dr SE
- 3011 169th St SE
- 3012 168th St SE
- 3101 168th St SE
- 3019 169th St SE
- 16713 30th Dr SE
- 16728 30th Dr SE
- 3004 168th St SE
- 16820 31st Dr SE
- 3005 169th St SE
- 16826 31st Dr SE
- 16724 30th Dr SE
- 3102 167th St SE
- 3030 167th St SE
- 3003 168th St SE
- 3110 168th St SE
- 3012 169th St SE
- 2930 168th St SE
- 16706 30th Dr SE
Your Personal Tour Guide
Ask me questions while you tour the home.