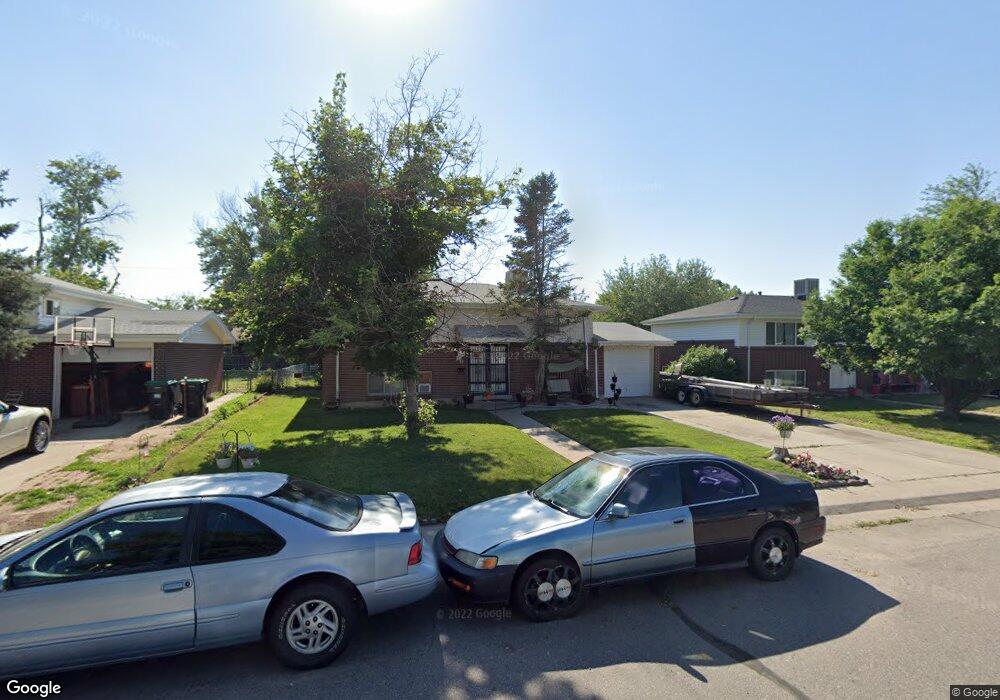
3028 Abilene St Aurora, CO 80011
Sable Altura Chambers NeighborhoodEstimated Value: $407,355 - $446,000
4
Beds
2
Baths
1,728
Sq Ft
$248/Sq Ft
Est. Value
About This Home
This home is located at 3028 Abilene St, Aurora, CO 80011 and is currently estimated at $428,839, approximately $248 per square foot. 3028 Abilene St is a home located in Adams County with nearby schools including Park Lane Elementary School, North Middle School Health Sciences & Technology, and Hinkley High School.
Ownership History
Date
Name
Owned For
Owner Type
Purchase Details
Closed on
Nov 9, 2007
Sold by
U S Bank Na
Bought by
Dunn John M
Current Estimated Value
Home Financials for this Owner
Home Financials are based on the most recent Mortgage that was taken out on this home.
Original Mortgage
$100,800
Outstanding Balance
$63,414
Interest Rate
6.27%
Mortgage Type
Unknown
Estimated Equity
$365,425
Purchase Details
Closed on
Dec 11, 2006
Sold by
Padilla Emelia and Padilla Evelio
Bought by
U S Bank Na
Purchase Details
Closed on
Sep 21, 2001
Sold by
Ortiz Wayne M
Bought by
Padilla Evelio and Padilla Emelia
Home Financials for this Owner
Home Financials are based on the most recent Mortgage that was taken out on this home.
Original Mortgage
$159,550
Interest Rate
6.96%
Purchase Details
Closed on
Apr 19, 2000
Sold by
Ortiz Joyce A
Bought by
Ortiz Wayne M
Create a Home Valuation Report for This Property
The Home Valuation Report is an in-depth analysis detailing your home's value as well as a comparison with similar homes in the area
Home Values in the Area
Average Home Value in this Area
Purchase History
| Date | Buyer | Sale Price | Title Company |
|---|---|---|---|
| Dunn John M | $112,000 | Chicago Title Co | |
| U S Bank Na | -- | None Available | |
| Padilla Evelio | $167,950 | Security Title | |
| Ortiz Wayne M | -- | -- |
Source: Public Records
Mortgage History
| Date | Status | Borrower | Loan Amount |
|---|---|---|---|
| Open | Dunn John M | $100,800 | |
| Previous Owner | Padilla Evelio | $159,550 |
Source: Public Records
Tax History Compared to Growth
Tax History
| Year | Tax Paid | Tax Assessment Tax Assessment Total Assessment is a certain percentage of the fair market value that is determined by local assessors to be the total taxable value of land and additions on the property. | Land | Improvement |
|---|---|---|---|---|
| 2024 | $2,661 | $24,310 | $5,310 | $19,000 |
| 2023 | $2,703 | $29,090 | $5,750 | $23,340 |
| 2022 | $2,296 | $20,210 | $5,490 | $14,720 |
| 2021 | $2,393 | $20,210 | $5,490 | $14,720 |
| 2020 | $2,560 | $21,690 | $5,650 | $16,040 |
| 2019 | $2,555 | $21,690 | $5,650 | $16,040 |
| 2018 | $1,998 | $16,890 | $5,040 | $11,850 |
| 2017 | $1,775 | $16,890 | $5,040 | $11,850 |
| 2016 | $1,267 | $11,960 | $2,590 | $9,370 |
| 2015 | $1,228 | $11,960 | $2,590 | $9,370 |
| 2014 | $1,059 | $10,160 | $2,150 | $8,010 |
Source: Public Records
Map
Nearby Homes
- 3098 Zion St
- 3065 Zion St
- 3000 Billings St
- 3055 Carson St
- 3229 Blackhawk Cir
- 3222 Blackhawk Cir
- 3225 Carson St
- 3110 Cimarron St
- 3090 Worchester St
- 3086 Wheeling St
- 2521 Billings St
- 2507 Zion St
- 14131 E 24th Ave
- 3195 Uvalda St
- 14200 E 22nd Place
- 3176 Ursula St
- 14220 E 22nd Place
- 2507 Fairplay St
- 14900 E 24th Ave
- 1985 Blackhawk St
- 3020 Abilene St
- 3036 Abilene St
- 3014 Abilene St
- 3044 Abilene St
- 3045 Atchison St
- 3055 Atchison St
- 3035 Atchison St
- 3065 Atchison St
- 3010 Abilene St
- 3054 Abilene St
- 3025 Atchison St
- 3033 Abilene St
- 3027 Abilene St
- 3039 Abilene St
- 3075 Atchison St
- 3021 Abilene St
- 3015 Atchison St
- 3047 Abilene St
- 3064 Abilene St
- 3002 Abilene St