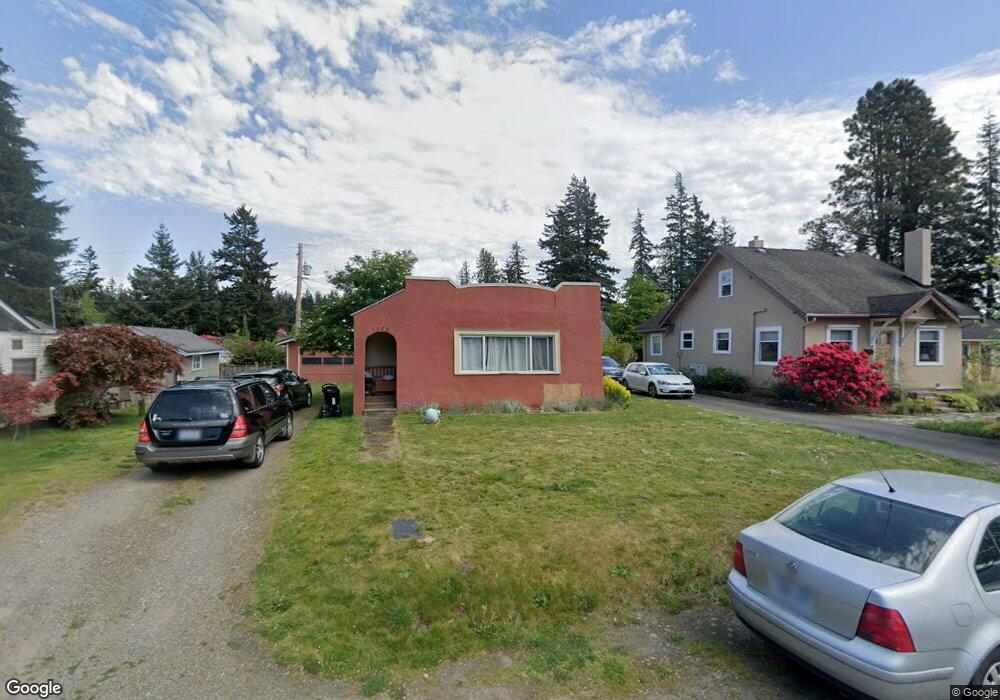
3028 Elm St Bellingham, WA 98225
Columbia NeighborhoodEstimated Value: $456,649 - $552,000
1
Bed
1
Bath
520
Sq Ft
$937/Sq Ft
Est. Value
About This Home
This home is located at 3028 Elm St, Bellingham, WA 98225 and is currently estimated at $487,162, approximately $936 per square foot. 3028 Elm St is a home located in Whatcom County with nearby schools including Parkview Elementary School, Whatcom Middle School, and Bellingham High School.
Ownership History
Date
Name
Owned For
Owner Type
Purchase Details
Closed on
Aug 13, 2022
Sold by
Lyn Hueter Sherrie
Bought by
Aquazul Llc
Current Estimated Value
Purchase Details
Closed on
Apr 19, 2022
Sold by
Hueter Sherrie Lyn and Hueter Harendra K
Bought by
2021 Harendra Goonetilleke And Sherrie Hueter and Goonetilleke
Purchase Details
Closed on
Jun 24, 2003
Sold by
Wasley Peter and Wasley Pamela
Bought by
Hueter Sherrie Lyn and Goonetilleke Harendra K
Home Financials for this Owner
Home Financials are based on the most recent Mortgage that was taken out on this home.
Original Mortgage
$106,650
Interest Rate
5.26%
Mortgage Type
Purchase Money Mortgage
Purchase Details
Closed on
Apr 12, 1999
Sold by
Wheeler Donald E and Wheeler Margaret
Bought by
Wasley Peter and Wasley Pamela
Home Financials for this Owner
Home Financials are based on the most recent Mortgage that was taken out on this home.
Original Mortgage
$45,000
Interest Rate
7.04%
Create a Home Valuation Report for This Property
The Home Valuation Report is an in-depth analysis detailing your home's value as well as a comparison with similar homes in the area
Home Values in the Area
Average Home Value in this Area
Purchase History
| Date | Buyer | Sale Price | Title Company |
|---|---|---|---|
| Aquazul Llc | -- | Chmelik Sitkin & Davis Ps | |
| 2021 Harendra Goonetilleke And Sherrie Hueter | $313 | None Listed On Document | |
| Hueter Sherrie Lyn | $118,500 | Stewart Title Company | |
| Wasley Peter | -- | Island Title Company |
Source: Public Records
Mortgage History
| Date | Status | Borrower | Loan Amount |
|---|---|---|---|
| Previous Owner | Hueter Sherrie Lyn | $106,650 | |
| Previous Owner | Wasley Peter | $45,000 |
Source: Public Records
Tax History Compared to Growth
Tax History
| Year | Tax Paid | Tax Assessment Tax Assessment Total Assessment is a certain percentage of the fair market value that is determined by local assessors to be the total taxable value of land and additions on the property. | Land | Improvement |
|---|---|---|---|---|
| 2024 | $3,570 | $447,128 | $246,304 | $200,824 |
| 2023 | $3,570 | $458,485 | $252,560 | $205,925 |
| 2022 | $2,914 | $395,253 | $217,728 | $177,525 |
| 2021 | $2,859 | $313,692 | $172,800 | $140,892 |
| 2020 | $2,738 | $290,456 | $160,000 | $130,456 |
| 2019 | $2,452 | $268,912 | $136,423 | $132,489 |
| 2018 | $2,469 | $241,396 | $122,483 | $118,913 |
| 2017 | $2,127 | $207,834 | $105,452 | $102,382 |
| 2016 | $1,862 | $187,187 | $94,628 | $92,559 |
| 2015 | $1,826 | $170,601 | $86,428 | $84,173 |
| 2014 | -- | $161,861 | $82,000 | $79,861 |
| 2013 | -- | $153,870 | $73,500 | $80,370 |
Source: Public Records
Map
Nearby Homes
- 3018 Elm St
- 3008 Meridian St
- 1508 E Maplewood Ave
- 2805 Walnut St
- 2600 Elm St
- 2500 Meridian St
- 3330 Northwest Ave
- 3000 Firwood Ave
- 2715 W Maplewood Ave Unit 122
- 3350 Northwest Ave Unit 1102
- 1800 J St
- 2500 Cornwall Ave
- 2218 Jaeger St
- 2829 Cottonwood Ave
- 1410 J St
- 1315 Astor St
- 2721 Mcleod Rd
- 4506 Meridian St
- 3729 Meridian St
- 1200 W Holly St