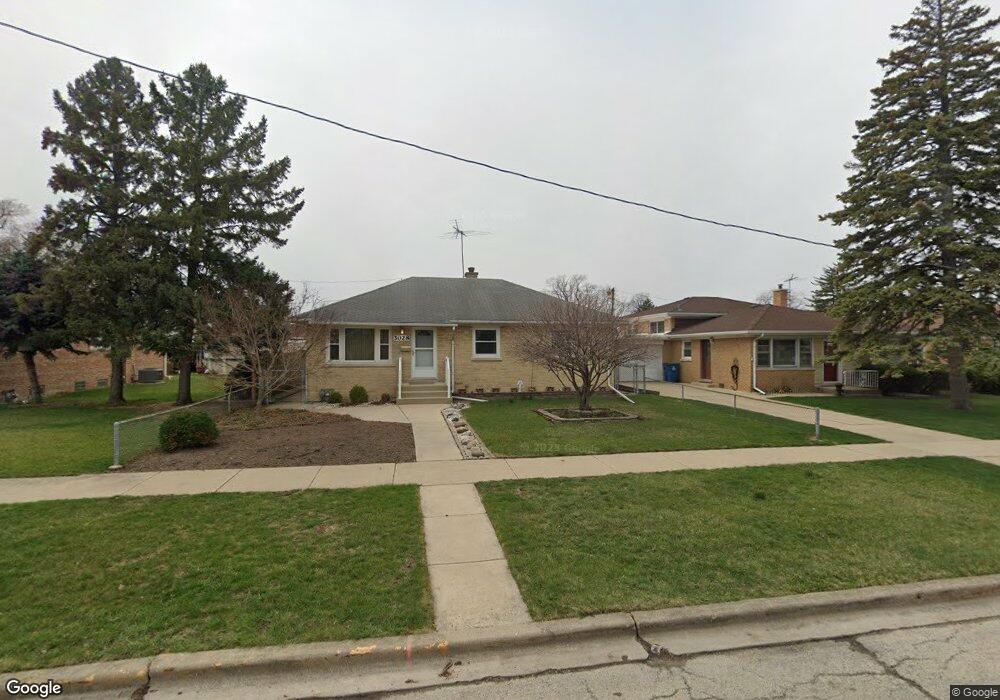
3028 Louis St Franklin Park, IL 60131
Estimated Value: $283,000 - $321,000
2
Beds
1
Bath
868
Sq Ft
$348/Sq Ft
Est. Value
About This Home
This home is located at 3028 Louis St, Franklin Park, IL 60131 and is currently estimated at $301,703, approximately $347 per square foot. 3028 Louis St is a home located in Cook County with nearby schools including Roy Elementary School, Mannheim Middle School, and West Leyden High School.
Ownership History
Date
Name
Owned For
Owner Type
Purchase Details
Closed on
Jan 31, 2025
Sold by
Kowalski August J
Bought by
Mazur Jeremy C
Current Estimated Value
Home Financials for this Owner
Home Financials are based on the most recent Mortgage that was taken out on this home.
Original Mortgage
$154,000
Interest Rate
6.72%
Mortgage Type
New Conventional
Purchase Details
Closed on
Mar 4, 2013
Sold by
Kowalski August J
Bought by
Kowalski August J
Purchase Details
Closed on
Aug 2, 2012
Sold by
Kowalski Geraldine M
Bought by
Kowalski Geraldine M
Create a Home Valuation Report for This Property
The Home Valuation Report is an in-depth analysis detailing your home's value as well as a comparison with similar homes in the area
Home Values in the Area
Average Home Value in this Area
Purchase History
| Date | Buyer | Sale Price | Title Company |
|---|---|---|---|
| Mazur Jeremy C | $294,000 | None Listed On Document | |
| Kowalski August J | -- | None Available | |
| Kowalski Geraldine M | -- | None Available |
Source: Public Records
Mortgage History
| Date | Status | Borrower | Loan Amount |
|---|---|---|---|
| Closed | Mazur Jeremy C | $154,000 |
Source: Public Records
Tax History Compared to Growth
Tax History
| Year | Tax Paid | Tax Assessment Tax Assessment Total Assessment is a certain percentage of the fair market value that is determined by local assessors to be the total taxable value of land and additions on the property. | Land | Improvement |
|---|---|---|---|---|
| 2024 | $1,319 | $12,202 | $2,790 | $9,412 |
| 2023 | $1,340 | $12,202 | $2,790 | $9,412 |
| 2022 | $1,340 | $12,202 | $2,790 | $9,412 |
| 2021 | $1,566 | $8,029 | $2,015 | $6,014 |
| 2020 | $1,447 | $8,029 | $2,015 | $6,014 |
| 2019 | $1,475 | $9,073 | $2,015 | $7,058 |
| 2018 | $2,213 | $7,321 | $1,705 | $5,616 |
| 2017 | $2,213 | $7,321 | $1,705 | $5,616 |
| 2016 | $2,580 | $8,267 | $1,705 | $6,562 |
| 2015 | $2,372 | $7,417 | $1,550 | $5,867 |
| 2014 | $2,336 | $7,417 | $1,550 | $5,867 |
| 2013 | $2,235 | $7,417 | $1,550 | $5,867 |
Source: Public Records
Map
Nearby Homes