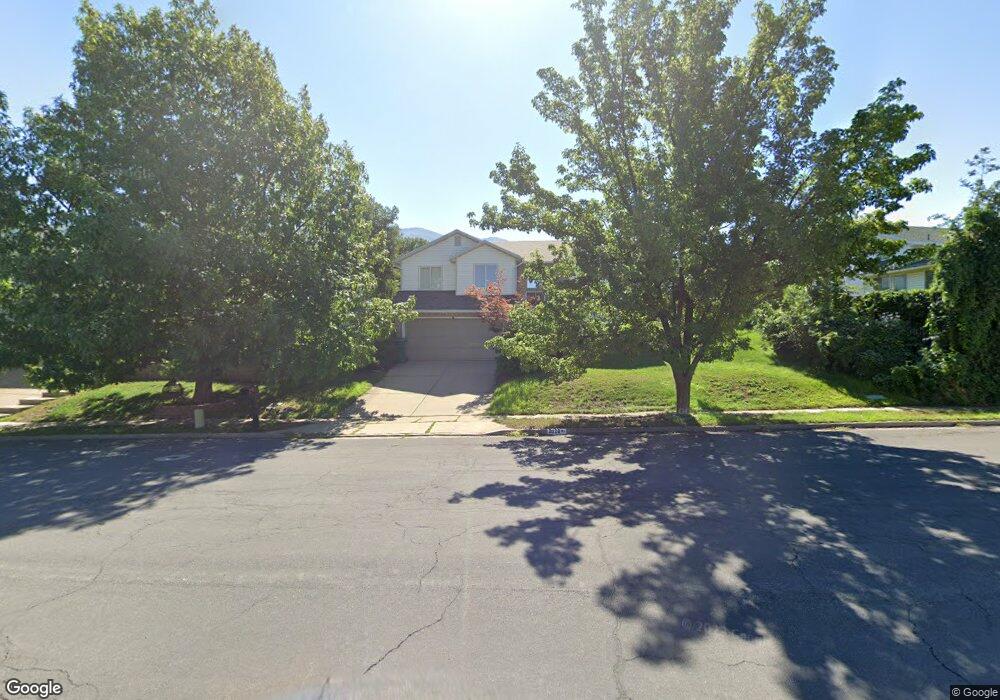
3028 N 2175 E Layton, UT 84040
Estimated Value: $491,000 - $516,000
4
Beds
3
Baths
1,986
Sq Ft
$252/Sq Ft
Est. Value
About This Home
This home is located at 3028 N 2175 E, Layton, UT 84040 and is currently estimated at $500,221, approximately $251 per square foot. 3028 N 2175 E is a home located in Davis County with nearby schools including Mountain View Elementary School, North Layton Junior High School, and Northridge High School.
Ownership History
Date
Name
Owned For
Owner Type
Purchase Details
Closed on
May 31, 2019
Sold by
Hibbert Julie and Estate Of Spencer C Hibbert
Bought by
Sierra Wendi H and Sierra Oman A
Current Estimated Value
Home Financials for this Owner
Home Financials are based on the most recent Mortgage that was taken out on this home.
Original Mortgage
$123,275
Outstanding Balance
$65,755
Interest Rate
4.1%
Mortgage Type
New Conventional
Estimated Equity
$434,466
Purchase Details
Closed on
Oct 10, 2002
Sold by
Gertge Edward
Bought by
Hibbert Spencer
Home Financials for this Owner
Home Financials are based on the most recent Mortgage that was taken out on this home.
Original Mortgage
$155,900
Interest Rate
6.07%
Mortgage Type
Seller Take Back
Purchase Details
Closed on
Feb 13, 2001
Sold by
Mckenzie Kalen C and Mckenzie Corrie
Bought by
Gertge Hollie Jo
Create a Home Valuation Report for This Property
The Home Valuation Report is an in-depth analysis detailing your home's value as well as a comparison with similar homes in the area
Home Values in the Area
Average Home Value in this Area
Purchase History
| Date | Buyer | Sale Price | Title Company |
|---|---|---|---|
| Sierra Wendi H | -- | Backman Title Service | |
| Hibbert Spencer | -- | Founders Title Co Layton | |
| Gertge Edward | -- | Founders Title Co Layton | |
| Gertge Hollie Jo | -- | Bonneville Title Company Inc |
Source: Public Records
Mortgage History
| Date | Status | Borrower | Loan Amount |
|---|---|---|---|
| Open | Sierra Wendi H | $123,275 | |
| Previous Owner | Hibbert Spencer | $155,900 |
Source: Public Records
Tax History
| Year | Tax Paid | Tax Assessment Tax Assessment Total Assessment is a certain percentage of the fair market value that is determined by local assessors to be the total taxable value of land and additions on the property. | Land | Improvement |
|---|---|---|---|---|
| 2025 | $2,311 | $242,550 | $112,234 | $130,316 |
| 2024 | $2,211 | $233,750 | $138,031 | $95,719 |
| 2023 | $2,184 | $407,000 | $190,768 | $216,232 |
| 2022 | $2,288 | $231,550 | $101,913 | $129,637 |
| 2021 | $2,093 | $316,000 | $154,444 | $161,556 |
| 2020 | $1,892 | $274,000 | $122,471 | $151,529 |
| 2019 | $1,861 | $264,000 | $109,957 | $154,043 |
| 2018 | $1,678 | $239,000 | $66,872 | $172,128 |
| 2016 | $1,527 | $112,200 | $33,795 | $78,405 |
| 2015 | $1,455 | $101,475 | $33,795 | $67,680 |
| 2014 | $1,554 | $110,786 | $33,795 | $76,991 |
| 2013 | -- | $102,923 | $26,884 | $76,039 |
Source: Public Records
Map
Nearby Homes
- 2353 Canyon View Dr
- 3232 N Redtail Way
- 1935 Deere Valley Dr
- 1821 E Whitetail Way
- 1827 E Whitetail Dr
- 2597 N 2300 E
- 1785 E 2825 N
- 1731 E 2825 N
- 2826 N 1600 E
- 2340 N 2050 E
- 2569 N 2900 E
- 3176 N 1450 E
- 3142 E Thorley Dr
- 2273 N 1975 E
- 2202 N 2300 E
- 2563 E 2250 N
- 1447 E 2700 N
- 3297 N Layton Ridge Dr
- 2189 N 1950 E
- 1321 E 3125 N
Your Personal Tour Guide
Ask me questions while you tour the home.