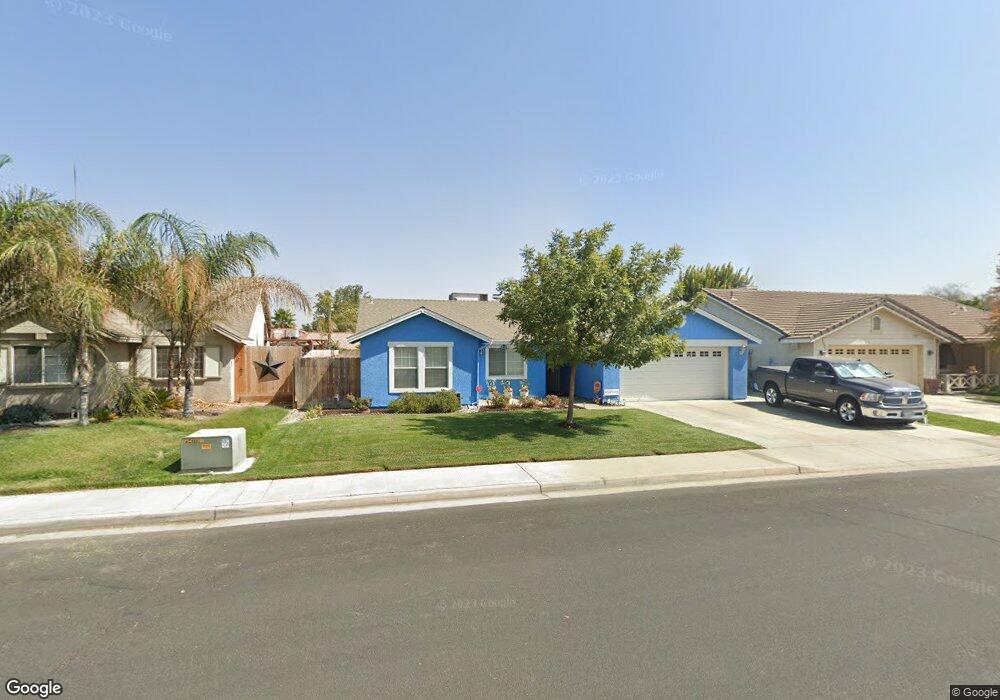
3029 Pine St Hanford, CA 93230
Estimated Value: $384,086 - $414,000
About This Home
This home is located at 3029 Pine St, Hanford, CA 93230 and is currently estimated at $400,772, approximately $250 per square foot. 3029 Pine St is a home located in Kings County with nearby schools including Hanford West High School, Pioneer Elementary School, and Pioneer Middle School.
Ownership History
We collect this data history from publicly available records. To have your information removed, we recommend requesting removal directly through your county’s website.
Purchase Details
Purchase Details
Purchase Details
Home Financials for this Owner
Home Financials are based on the most recent Mortgage that was taken out on this home.Home Values in the Area
Average Home Value in this Area
Purchase History
We collect this data history from publicly available records. To have your information removed, we recommend requesting removal directly through your county’s website.
| Date | Buyer | Sale Price | Title Company |
|---|---|---|---|
| -- | None Available | ||
| $205,000 | Chicago Title Company | ||
| $106,000 | First American Title Co |
Mortgage History
We collect this data history from publicly available records. To have your information removed, we recommend requesting removal directly through your county’s website.
| Date | Status | Borrower | Loan Amount |
|---|---|---|---|
| Previous Owner | $105,787 |
Tax History
We collect this data history from publicly available records. To have your information removed, we recommend requesting removal directly through your county’s website.
| Year | Tax Paid | Tax Assessment Tax Assessment Total Assessment is a certain percentage of the fair market value that is determined by local assessors to be the total taxable value of land and additions on the property. | Land | Improvement |
|---|---|---|---|---|
| 2025 | $2,686 | $251,299 | $73,552 | $177,747 |
| 2023 | $2,686 | $241,543 | $70,697 | $170,846 |
| 2022 | $2,601 | $236,808 | $69,311 | $167,497 |
| 2021 | $2,554 | $232,165 | $67,952 | $164,213 |
| 2020 | $2,560 | $229,784 | $67,255 | $162,529 |
| 2019 | $2,518 | $225,278 | $65,936 | $159,342 |
| 2018 | $2,503 | $220,861 | $64,643 | $156,218 |
| 2017 | $2,459 | $216,530 | $63,375 | $153,155 |
| 2016 | $2,328 | $212,284 | $62,132 | $150,152 |
| 2015 | $2,257 | $209,096 | $61,199 | $147,897 |
| 2014 | $2,350 | $205,000 | $60,000 | $145,000 |
Map
- 440 W Pepper Dr
- 440 Pepper Dr
- 3026 Sage Ct
- 100 W Adrian Way
- 2889 Adrian Cir
- 916 W Windsor Dr
- 917 W Windsor Dr
- 791 W Pebble Dr
- 795 Northstar Dr
- 10660 Flint Ave
- 0 Flint Ave
- 2479 Cabrillo Ct
- 1007 W Saffron St
- 299 Orange Ct
- 230 W Ash Ave
- 2479 Carter Way
- 547 Coronado Place
- 903 W Redwood St
- 1068 W Pepper Dr
- 3177 Mission Dr
Ask me questions while you tour the home.