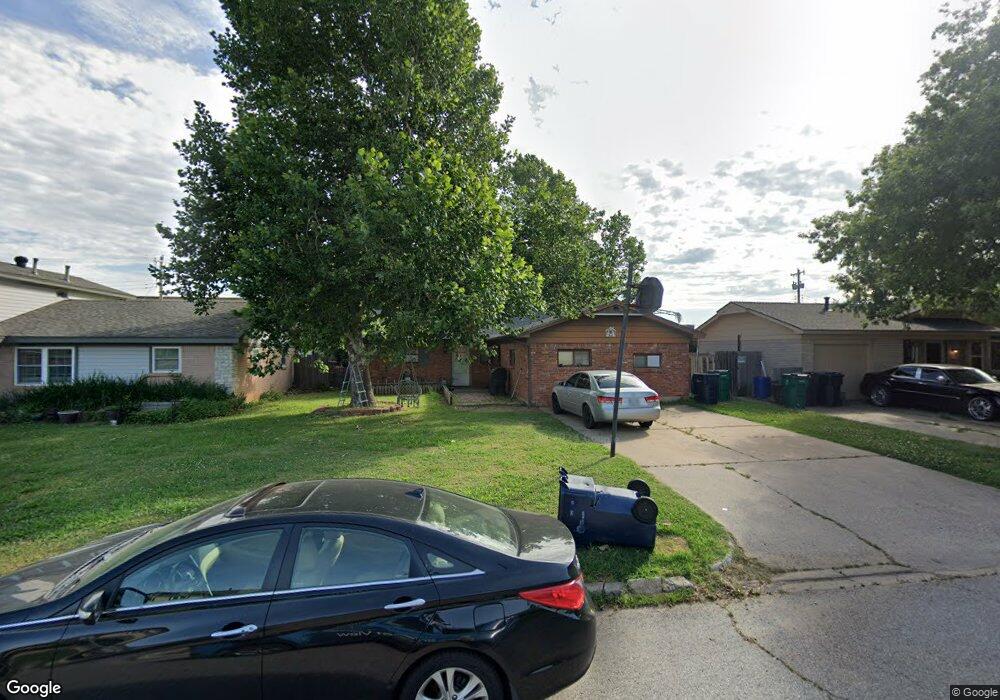
3029 SW 60th St Oklahoma City, OK 73159
Estimated Value: $162,773 - $177,000
3
Beds
2
Baths
1,542
Sq Ft
$111/Sq Ft
Est. Value
About This Home
This home is located at 3029 SW 60th St, Oklahoma City, OK 73159 and is currently estimated at $171,443, approximately $111 per square foot. 3029 SW 60th St is a home located in Oklahoma County with nearby schools including Hillcrest Elementary School, Jefferson Middle School, and U. S. Grant High School.
Ownership History
Date
Name
Owned For
Owner Type
Purchase Details
Closed on
Feb 27, 2024
Sold by
Kim Vanhuynh and Kim Thu
Bought by
Trt Thu Kim-Rev Liv and Trt Huynh
Current Estimated Value
Purchase Details
Closed on
Sep 21, 2012
Sold by
Citifinancial Services Inc
Bought by
Huynh Hung V and Huynh Thu K
Purchase Details
Closed on
Jun 7, 2012
Sold by
Marchand J Brandon
Bought by
Citi Financial Services Inc
Purchase Details
Closed on
May 8, 2006
Sold by
Marchand J Brandon
Bought by
Marchand Roger A and Marchand Virginia Ann
Purchase Details
Closed on
Oct 1, 2004
Sold by
Marchand Roger A and Marchand Virginia Ann
Bought by
Marchand Roger A and Marchand Virginia Ann
Purchase Details
Closed on
Dec 17, 2003
Sold by
Marchand Roger A
Bought by
Marchand Roger A and Marchand Virginia Ann
Create a Home Valuation Report for This Property
The Home Valuation Report is an in-depth analysis detailing your home's value as well as a comparison with similar homes in the area
Home Values in the Area
Average Home Value in this Area
Purchase History
| Date | Buyer | Sale Price | Title Company |
|---|---|---|---|
| Trt Thu Kim-Rev Liv | -- | None Listed On Document | |
| Huynh Hung V | $46,000 | Oklahoma Reo Closing & Tit | |
| Citi Financial Services Inc | -- | None Available | |
| Marchand Roger A | -- | None Available | |
| Marchand Roger A | -- | Stewart Abstract & Title Of | |
| Marchand J Brandon | -- | Stewart Abstract & Title Of | |
| Marchand Roger A | -- | -- |
Source: Public Records
Tax History Compared to Growth
Tax History
| Year | Tax Paid | Tax Assessment Tax Assessment Total Assessment is a certain percentage of the fair market value that is determined by local assessors to be the total taxable value of land and additions on the property. | Land | Improvement |
|---|---|---|---|---|
| 2024 | $1,650 | $14,640 | $2,479 | $12,161 |
| 2023 | $1,650 | $13,942 | $2,262 | $11,680 |
| 2022 | $1,496 | $13,279 | $2,318 | $10,961 |
| 2021 | $1,420 | $12,647 | $1,854 | $10,793 |
| 2020 | $1,364 | $12,045 | $1,967 | $10,078 |
| 2019 | $1,375 | $12,185 | $1,963 | $10,222 |
| 2018 | $1,314 | $11,605 | $0 | $0 |
| 2017 | $1,269 | $11,219 | $1,967 | $9,252 |
| 2016 | $1,245 | $10,999 | $1,967 | $9,032 |
| 2015 | $1,257 | $10,998 | $1,967 | $9,031 |
| 2014 | $1,247 | $10,972 | $1,967 | $9,005 |
Source: Public Records
Map
Nearby Homes
- 3024 SW 61st St
- 2916 SW 61st St
- 2900 SW 61st St
- 6417 S Drexel Place
- 2837 SW 63rd St
- 3037 SW 64th St
- 3225 SW 62nd St
- 2701 SW 60th Place
- 3020 SW 65th Place
- 2633 SW 63rd St
- 2640 SW 57th St
- 2828 SW 54th Place
- 5409 S Land Ave
- 3048 SW 67th St
- 3261 S Madole Blvd
- 2733 SW 54th Place
- 2632 SW 55th St
- 3016 SW 68th St
- 2625 SW 55th St
- 2836 SW 53rd St
- 3033 SW 60th St
- 3021 SW 60th St
- 3017 SW 60th St
- 6044 S Drexel Ave
- 3032 SW 60th St
- 3028 SW 60th St
- 3036 SW 60th St
- 3024 SW 60th St
- 6040 S Drexel Ave
- 3020 SW 60th St
- 6053 S Drexel Ave
- 3009 SW 60th St
- 6104 S Drexel Ave
- 6036 S Drexel Ave
- 3016 SW 60th St
- 6049 S Drexel Ave
- 3012 SW 60th St
- 6105 S Drexel Ave
- 6108 S Drexel Ave