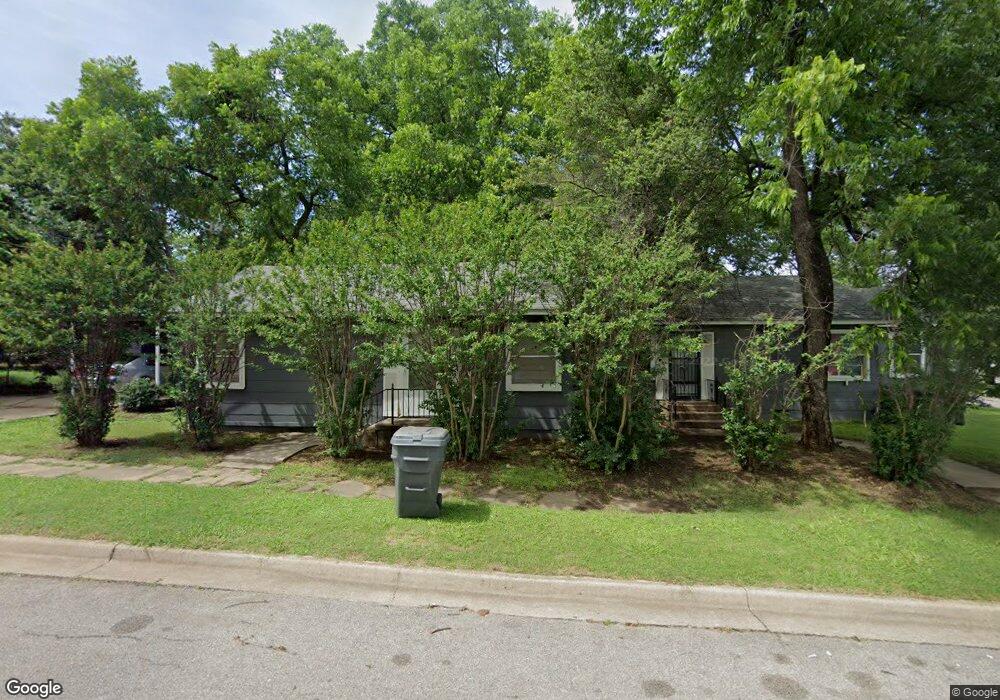
303 10th Ave NW Ardmore, OK 73401
Estimated Value: $135,000 - $233,000
4
Beds
2
Baths
1,645
Sq Ft
$101/Sq Ft
Est. Value
About This Home
This home is located at 303 10th Ave NW, Ardmore, OK 73401 and is currently estimated at $165,526, approximately $100 per square foot. 303 10th Ave NW is a home located in Carter County with nearby schools including Charles Evans Elementary School, Ardmore Middle School, and Ardmore High School.
Ownership History
Date
Name
Owned For
Owner Type
Purchase Details
Closed on
Dec 1, 2023
Sold by
Iron Throne Investments Llc
Bought by
Fire Investments Llc
Current Estimated Value
Home Financials for this Owner
Home Financials are based on the most recent Mortgage that was taken out on this home.
Original Mortgage
$120,311
Interest Rate
7.63%
Mortgage Type
New Conventional
Purchase Details
Closed on
Jun 26, 2019
Sold by
Runnels Rentaals Llc
Bought by
Iron Throne Investments Llc
Home Financials for this Owner
Home Financials are based on the most recent Mortgage that was taken out on this home.
Original Mortgage
$54,459
Interest Rate
4%
Mortgage Type
Commercial
Purchase Details
Closed on
Aug 14, 2008
Sold by
Lovell Dixie H
Bought by
Runnels John A and Runnels Sheryl J
Home Financials for this Owner
Home Financials are based on the most recent Mortgage that was taken out on this home.
Original Mortgage
$41,250
Interest Rate
6.38%
Mortgage Type
Commercial
Create a Home Valuation Report for This Property
The Home Valuation Report is an in-depth analysis detailing your home's value as well as a comparison with similar homes in the area
Home Values in the Area
Average Home Value in this Area
Purchase History
| Date | Buyer | Sale Price | Title Company |
|---|---|---|---|
| Fire Investments Llc | $85,000 | None Listed On Document | |
| Iron Throne Investments Llc | $65,000 | Stewart Title Of Ok Inc | |
| Runnels John A | $55,000 | -- |
Source: Public Records
Mortgage History
| Date | Status | Borrower | Loan Amount |
|---|---|---|---|
| Closed | Fire Investments Llc | $120,311 | |
| Previous Owner | Iron Throne Investments Llc | $54,459 | |
| Previous Owner | Runnels John A | $41,250 |
Source: Public Records
Tax History Compared to Growth
Tax History
| Year | Tax Paid | Tax Assessment Tax Assessment Total Assessment is a certain percentage of the fair market value that is determined by local assessors to be the total taxable value of land and additions on the property. | Land | Improvement |
|---|---|---|---|---|
| 2025 | $1,547 | $13,677 | $900 | $12,777 |
| 2024 | $1,547 | $15,495 | $900 | $14,595 |
| 2023 | $888 | $8,984 | $900 | $8,084 |
| 2022 | $818 | $8,556 | $900 | $7,656 |
| 2021 | $822 | $8,149 | $900 | $7,249 |
| 2020 | $776 | $7,800 | $780 | $7,020 |
| 2019 | $665 | $6,847 | $618 | $6,229 |
| 2018 | $644 | $6,521 | $589 | $5,932 |
| 2017 | $568 | $6,211 | $561 | $5,650 |
| 2016 | $551 | $5,915 | $702 | $5,213 |
| 2015 | $433 | $5,634 | $260 | $5,374 |
| 2014 | $541 | $6,043 | $260 | $5,783 |
Source: Public Records
Map
Nearby Homes
- 921 D St NW
- 1006 C St NW
- 802 Northwest Blvd
- 413 11th Ave NW
- 4015 Hwy 177
- 801 B St NW
- 906 B St NW
- 409 12th Ave NW
- 811 Hargrove St
- 902 Burch St
- 1010 Burch St NW
- 1228 D St NW
- 602 B St NW
- 613 A St NW
- 501 NW E St St
- 901 Wolverton St
- 1323 Hargrove St
- 0 NE 10th Ave Unit 2517786
- 1115 Harris St NW
- 520 Northwest Ave