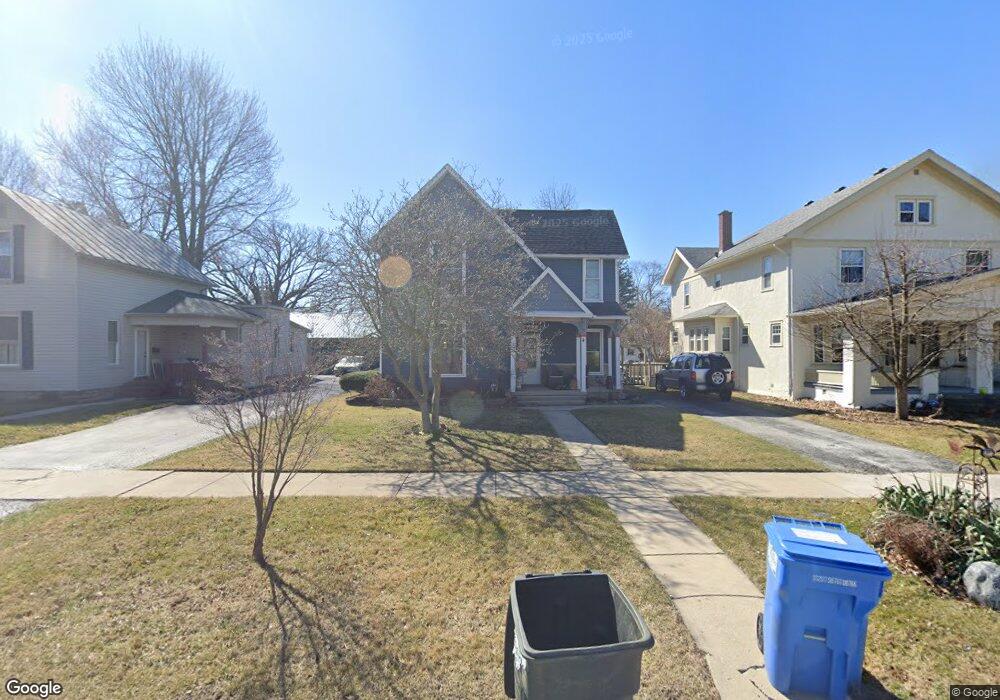
303 2nd St Findlay, OH 45840
Estimated Value: $216,000 - $257,000
3
Beds
3
Baths
1,904
Sq Ft
$128/Sq Ft
Est. Value
About This Home
This home is located at 303 2nd St, Findlay, OH 45840 and is currently estimated at $243,065, approximately $127 per square foot. 303 2nd St is a home located in Hancock County with nearby schools including Jefferson Elementary School, Chamberlin Hill Elementary School, and Donnell Middle School.
Ownership History
Date
Name
Owned For
Owner Type
Purchase Details
Closed on
Dec 11, 2001
Sold by
Relocation Properties Mg
Bought by
Zirger Douglas A and Zirger Michelle A
Current Estimated Value
Home Financials for this Owner
Home Financials are based on the most recent Mortgage that was taken out on this home.
Original Mortgage
$91,200
Outstanding Balance
$35,928
Interest Rate
6.68%
Mortgage Type
New Conventional
Estimated Equity
$207,137
Purchase Details
Closed on
Jun 4, 2001
Sold by
Mihaly William F
Bought by
Relocation Properties Mgmt Llc
Purchase Details
Closed on
May 21, 1985
Bought by
Mihaly William F and Mihaly Sharon
Purchase Details
Closed on
Dec 7, 1984
Bought by
Treece Eugene M and Treece Barbara
Purchase Details
Closed on
Jun 20, 1984
Bought by
Day Gladys R
Purchase Details
Closed on
May 12, 1983
Bought by
Day Day R and Day Gladys R
Create a Home Valuation Report for This Property
The Home Valuation Report is an in-depth analysis detailing your home's value as well as a comparison with similar homes in the area
Home Values in the Area
Average Home Value in this Area
Purchase History
| Date | Buyer | Sale Price | Title Company |
|---|---|---|---|
| Zirger Douglas A | $114,000 | -- | |
| Relocation Properties Mgmt Llc | $126,000 | -- | |
| Mihaly William F | -- | -- | |
| Treece Eugene M | -- | -- | |
| Day Gladys R | -- | -- | |
| Day Day R | -- | -- |
Source: Public Records
Mortgage History
| Date | Status | Borrower | Loan Amount |
|---|---|---|---|
| Open | Zirger Douglas A | $91,200 |
Source: Public Records
Tax History
| Year | Tax Paid | Tax Assessment Tax Assessment Total Assessment is a certain percentage of the fair market value that is determined by local assessors to be the total taxable value of land and additions on the property. | Land | Improvement |
|---|---|---|---|---|
| 2024 | $2,410 | $67,840 | $6,130 | $61,710 |
| 2023 | $2,414 | $67,840 | $6,130 | $61,710 |
| 2022 | $2,405 | $67,840 | $6,130 | $61,710 |
| 2021 | $1,928 | $47,360 | $6,130 | $41,230 |
| 2020 | $1,927 | $47,360 | $6,130 | $41,230 |
| 2019 | $1,889 | $47,360 | $6,130 | $41,230 |
| 2018 | $1,667 | $38,310 | $4,900 | $33,410 |
| 2017 | $833 | $38,310 | $4,900 | $33,410 |
| 2016 | $1,646 | $38,310 | $4,900 | $33,410 |
| 2015 | $1,411 | $32,270 | $4,900 | $27,370 |
| 2014 | $1,411 | $32,270 | $4,900 | $27,370 |
| 2012 | $1,424 | $32,270 | $4,900 | $27,370 |
Source: Public Records
Map
Nearby Homes
- 206 Greenlawn Ave
- 123 Glendale Ave
- 216 1st St
- 865 S Main St
- 829 Maple Ave
- 1304 Douglas Pkwy
- 324 W Mcpherson Ave
- 1113 Hurd Ave
- 731 5th St
- 423 Elm St
- 315 Fairlawn Place
- 331 Fairlawn Place
- 412 Lima Ave
- 416 1/2 Lima Ave
- 845 Hurd Ave
- 860 Hurd Ave
- 514 Liberty St
- 136 E Hobart Ave
- 1100 Stall Dr
- 15591 Canadian Way
Your Personal Tour Guide
Ask me questions while you tour the home.