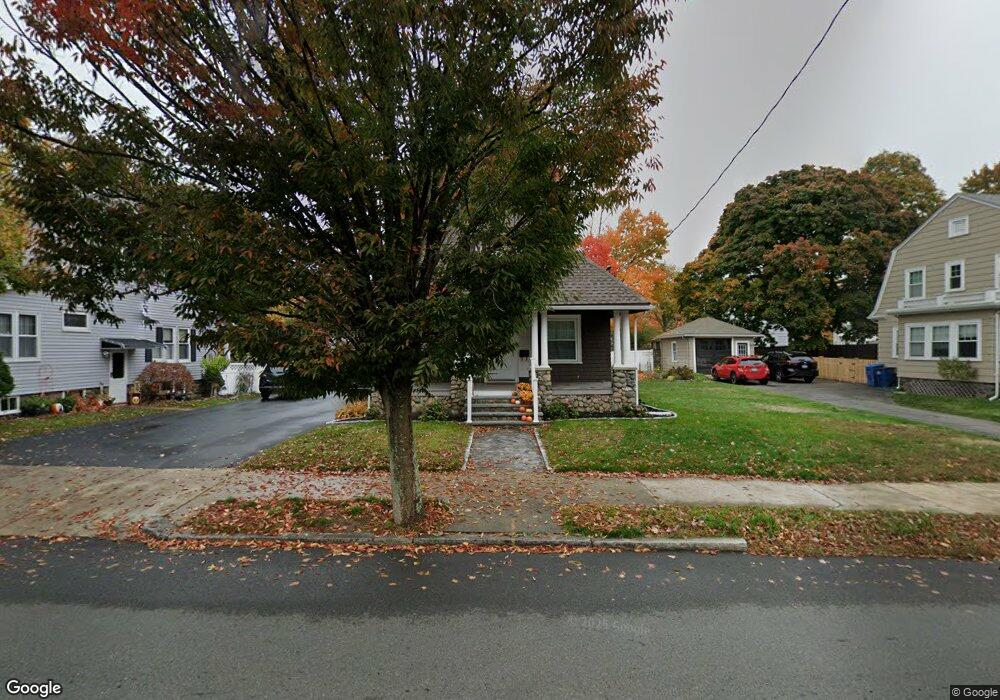
303 Albion St Wakefield, MA 01880
West Side NeighborhoodEstimated Value: $701,459 - $893,000
3
Beds
2
Baths
1,698
Sq Ft
$455/Sq Ft
Est. Value
About This Home
This home is located at 303 Albion St, Wakefield, MA 01880 and is currently estimated at $772,365, approximately $454 per square foot. 303 Albion St is a home located in Middlesex County with nearby schools including Wakefield Memorial High School, St Joseph School, and St. Patrick Elementary School.
Ownership History
Date
Name
Owned For
Owner Type
Purchase Details
Closed on
Apr 9, 2010
Sold by
Dube Mary A Est and Dube David L
Bought by
Benedetti Michael and Benedetti Sarah
Current Estimated Value
Home Financials for this Owner
Home Financials are based on the most recent Mortgage that was taken out on this home.
Original Mortgage
$285,600
Outstanding Balance
$191,347
Interest Rate
5.12%
Mortgage Type
Purchase Money Mortgage
Estimated Equity
$581,018
Create a Home Valuation Report for This Property
The Home Valuation Report is an in-depth analysis detailing your home's value as well as a comparison with similar homes in the area
Home Values in the Area
Average Home Value in this Area
Purchase History
| Date | Buyer | Sale Price | Title Company |
|---|---|---|---|
| Benedetti Michael | $357,000 | -- |
Source: Public Records
Mortgage History
| Date | Status | Borrower | Loan Amount |
|---|---|---|---|
| Open | Benedetti Michael | $285,600 |
Source: Public Records
Tax History
| Year | Tax Paid | Tax Assessment Tax Assessment Total Assessment is a certain percentage of the fair market value that is determined by local assessors to be the total taxable value of land and additions on the property. | Land | Improvement |
|---|---|---|---|---|
| 2025 | $6,690 | $589,400 | $314,600 | $274,800 |
| 2024 | $6,566 | $583,600 | $311,500 | $272,100 |
| 2023 | $6,224 | $530,600 | $282,900 | $247,700 |
| 2022 | $6,002 | $487,200 | $259,600 | $227,600 |
| 2021 | $5,479 | $430,400 | $234,300 | $196,100 |
| 2020 | $5,255 | $411,500 | $224,000 | $187,500 |
| 2019 | $4,981 | $388,200 | $211,300 | $176,900 |
| 2018 | $4,732 | $365,400 | $198,800 | $166,600 |
| 2017 | $4,600 | $353,000 | $192,100 | $160,900 |
| 2016 | $4,637 | $343,700 | $188,900 | $154,800 |
| 2015 | $4,419 | $327,800 | $180,000 | $147,800 |
| 2014 | $4,107 | $321,400 | $176,500 | $144,900 |
Source: Public Records
Map
Nearby Homes
- 55 Bartley St
- 248 Albion St Unit 231
- 248 Albion St Unit 321
- 69 Foundry St Unit 310
- 69 Foundry St Unit 416
- 62 Foundry St Unit 310
- 62 Foundry St Unit 204
- 62 Foundry St Unit 402
- 62 Foundry St Unit 507
- 62 Foundry St Unit 208
- 62 Foundry St Unit 414
- 62 Foundry St Unit 210
- 39 Cedar St
- 3 Valley Rd
- 95 Prospect St
- 11 Valdora Dr
- 62 High St Unit Lot 8
- 62 High St Unit 4
- 62 High St Unit Lot 5
- 62 High St Unit Lot 12
- 305 Albion St
- 299 Albion St
- 298 Albion St Unit 2
- 298 Albion St Unit 1
- 298 Albion St
- 307 Albion St
- 297 Albion St
- 48 Bartley St
- 48 Bartley St Unit 2
- 48 Bartley St Unit 1
- 16 Byron St
- 14 Byron St
- 14 Byron St Unit 1
- 295 Albion St
- 294 Albion St
- 50 Bartley St
- 309 Albion St
- 46 Bartley St Unit A
- 46 Bartley St
- 308 Albion St
Your Personal Tour Guide
Ask me questions while you tour the home.