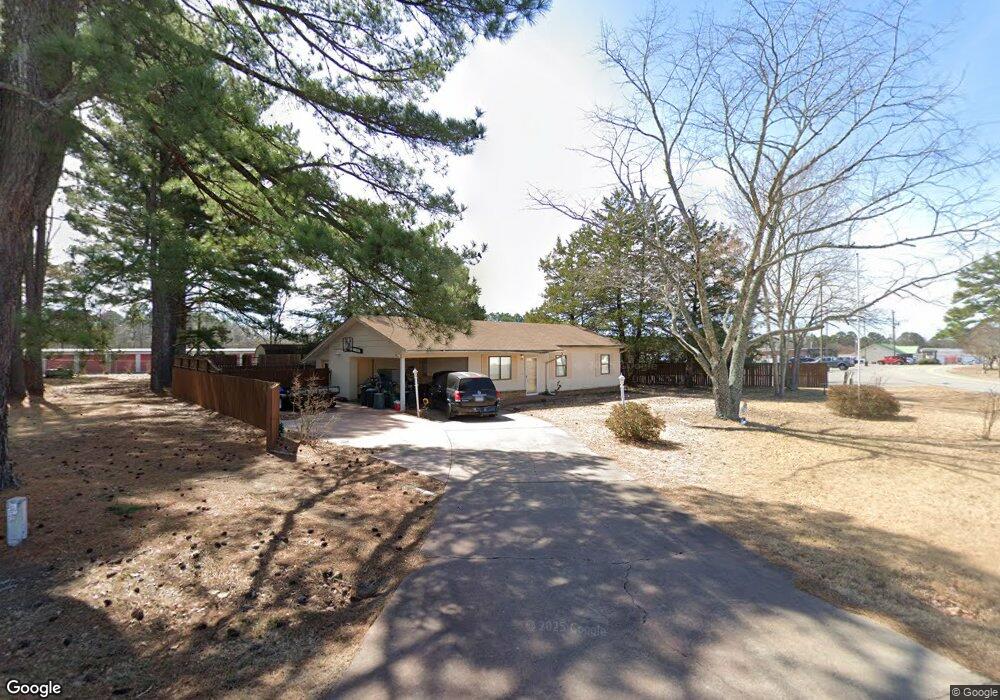
303 Atoka Dr Heber Springs, AR 72543
Estimated Value: $126,539 - $180,000
--
Bed
1
Bath
960
Sq Ft
$157/Sq Ft
Est. Value
About This Home
This home is located at 303 Atoka Dr, Heber Springs, AR 72543 and is currently estimated at $150,385, approximately $156 per square foot. 303 Atoka Dr is a home located in Cleburne County with nearby schools including Heber Springs Elementary School, Heber Springs Middle School, and Heber Springs High School.
Ownership History
Date
Name
Owned For
Owner Type
Purchase Details
Closed on
Jun 4, 2009
Sold by
Isaacs Eunas and Isaacs Maggie
Bought by
Isaacs Eunas and Isaacs Maggie
Current Estimated Value
Purchase Details
Closed on
Oct 6, 2003
Bought by
Isaacs Eunas and Isaacs Maggie
Purchase Details
Closed on
Oct 1, 2003
Bought by
Behrens Brad C
Purchase Details
Closed on
Jun 1, 1999
Bought by
Behrens Brad C and Behrens Myra K
Purchase Details
Closed on
Dec 9, 1998
Bought by
Mcirvin Arlen G and Georgie And
Purchase Details
Closed on
Nov 25, 1998
Bought by
Mcirvin Arlen G and Mcirvin Georgie
Purchase Details
Closed on
Nov 13, 1998
Bought by
Rooney Brenda J
Purchase Details
Closed on
Oct 30, 1998
Bought by
State Of Arkansas and Rooney Brenda J %
Purchase Details
Closed on
Aug 18, 1998
Bought by
State Of Arkansas and Rooney Brenda J %
Purchase Details
Closed on
Feb 1, 1989
Bought by
Rooney Brenda J
Create a Home Valuation Report for This Property
The Home Valuation Report is an in-depth analysis detailing your home's value as well as a comparison with similar homes in the area
Home Values in the Area
Average Home Value in this Area
Purchase History
| Date | Buyer | Sale Price | Title Company |
|---|---|---|---|
| Isaacs Eunas | -- | -- | |
| Isaacs Eunas | $70,000 | -- | |
| Behrens Brad C | -- | -- | |
| Behrens Brad C | $60,000 | -- | |
| Mcirvin Arlen G | -- | -- | |
| Mcirvin Arlen G | $40,000 | -- | |
| Rooney Brenda J | -- | -- | |
| State Of Arkansas | -- | -- | |
| State Of Arkansas | -- | -- | |
| Rooney Brenda J | -- | -- |
Source: Public Records
Tax History Compared to Growth
Tax History
| Year | Tax Paid | Tax Assessment Tax Assessment Total Assessment is a certain percentage of the fair market value that is determined by local assessors to be the total taxable value of land and additions on the property. | Land | Improvement |
|---|---|---|---|---|
| 2024 | $811 | $18,869 | $3,000 | $15,869 |
| 2023 | $775 | $18,869 | $3,000 | $15,869 |
| 2022 | $711 | $18,869 | $3,000 | $15,869 |
| 2021 | $646 | $15,022 | $3,000 | $12,022 |
| 2020 | $646 | $15,022 | $3,000 | $12,022 |
| 2019 | $643 | $15,022 | $3,000 | $12,022 |
| 2018 | $630 | $15,022 | $3,000 | $12,022 |
| 2017 | $578 | $15,022 | $3,000 | $12,022 |
| 2016 | $525 | $12,412 | $1,400 | $11,012 |
| 2015 | -- | $12,412 | $1,400 | $11,012 |
| 2014 | $525 | $12,412 | $1,400 | $11,012 |
Source: Public Records
Map
Nearby Homes
- 209 Trailwood Dr
- 404 Trailwood Dr
- 1604 Ridgefield Dr
- 1401 Roe's Ridge
- 1412 Ridgefield Dr
- 2421 Hwy 25b N
- Lot 4 Thelma St
- 863 Copperfield Cove
- 2255 Highway 25b
- 2323 Pinewood Dr
- 0 Woodland Bluff Dr
- 2400 Pinewood Dr
- 2002 Lakeshore Dr
- 603 Edgewater Cove
- Lot 26 Scenic Place
- 602 Edgewater Cove
- Lot 16 Wisdom Pointe
- 000 Edgewater Cove
- 307 Lo Hawk Dr
- Lots 44 & 45 Lakeview Dr