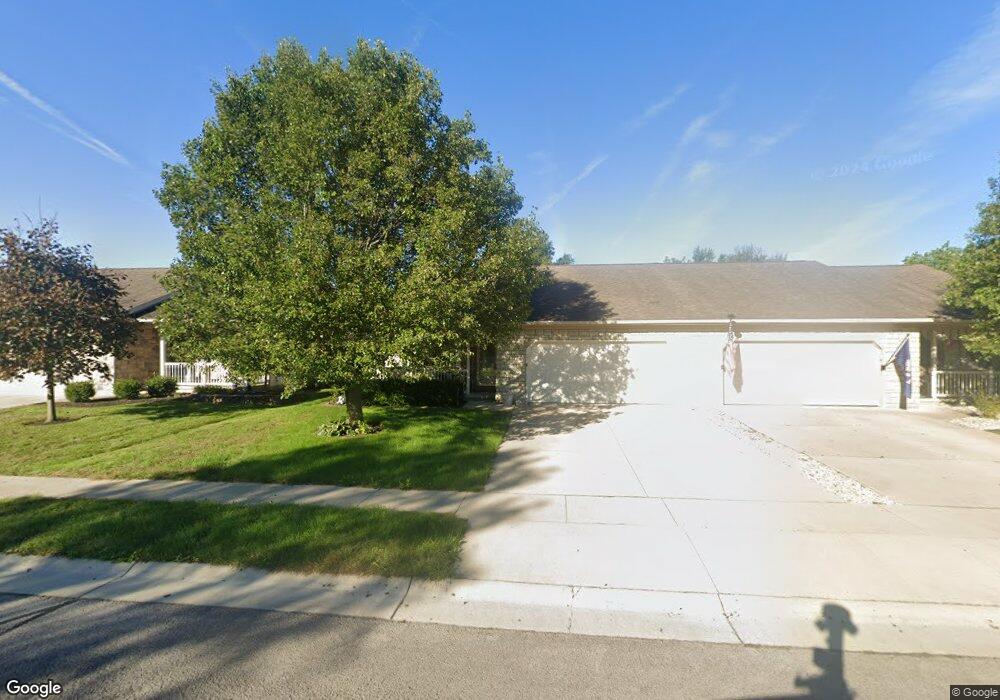
303 Cheyenne Dr Wapakoneta, OH 45895
Estimated Value: $150,000 - $182,000
2
Beds
2
Baths
1,214
Sq Ft
$135/Sq Ft
Est. Value
About This Home
This home is located at 303 Cheyenne Dr, Wapakoneta, OH 45895 and is currently estimated at $163,711, approximately $134 per square foot. 303 Cheyenne Dr is a home located in Auglaize County with nearby schools including Wapakoneta Elementary School, Wapakoneta High School, and Wapakoneta Middle School.
Ownership History
Date
Name
Owned For
Owner Type
Purchase Details
Closed on
Aug 23, 2021
Sold by
Knoch Barbara A
Bought by
Hatfield Scott A and Hatfield Tracy L
Current Estimated Value
Purchase Details
Closed on
May 20, 2020
Sold by
Brentlinger Patty L
Bought by
Hatfield Tracy L and Schuilze Tash L
Purchase Details
Closed on
Aug 18, 2010
Sold by
Cheyenne Drive Llc
Bought by
Brentlinger John W and Brentlinger Patty L
Home Financials for this Owner
Home Financials are based on the most recent Mortgage that was taken out on this home.
Original Mortgage
$107,551
Interest Rate
4.5%
Mortgage Type
FHA
Purchase Details
Closed on
Jan 20, 2007
Sold by
Wildenhaus Barbara Marker and Marker Robert E
Bought by
Cheyenne Drive Llc
Purchase Details
Closed on
Mar 26, 2003
Sold by
Marker Robert E
Bought by
Wildenhaus Barbara Marker
Purchase Details
Closed on
Jan 24, 2003
Bought by
Marker Robert E
Create a Home Valuation Report for This Property
The Home Valuation Report is an in-depth analysis detailing your home's value as well as a comparison with similar homes in the area
Home Values in the Area
Average Home Value in this Area
Purchase History
| Date | Buyer | Sale Price | Title Company |
|---|---|---|---|
| Hatfield Scott A | $107,800 | None Available | |
| Knoch Barbara A | -- | None Available | |
| Hatfield Tracy L | $132,000 | None Available | |
| Brentlinger John W | $109,000 | World Class Title Agency | |
| Cheyenne Drive Llc | -- | None Available | |
| Wildenhaus Barbara Marker | -- | -- | |
| Marker Robert E | $99,400 | -- |
Source: Public Records
Mortgage History
| Date | Status | Borrower | Loan Amount |
|---|---|---|---|
| Previous Owner | Brentlinger John W | $107,551 |
Source: Public Records
Tax History Compared to Growth
Tax History
| Year | Tax Paid | Tax Assessment Tax Assessment Total Assessment is a certain percentage of the fair market value that is determined by local assessors to be the total taxable value of land and additions on the property. | Land | Improvement |
|---|---|---|---|---|
| 2024 | $2,187 | $44,860 | $7,320 | $37,540 |
| 2023 | $1,508 | $44,860 | $7,320 | $37,540 |
| 2022 | $1,374 | $37,720 | $6,600 | $31,120 |
| 2021 | $1,354 | $37,720 | $6,600 | $31,120 |
| 2020 | $671 | $37,720 | $6,605 | $31,115 |
| 2019 | $819 | $31,024 | $5,432 | $25,592 |
| 2018 | $822 | $31,024 | $5,432 | $25,592 |
| 2017 | $820 | $31,024 | $5,432 | $25,592 |
| 2016 | $859 | $32,215 | $5,100 | $27,115 |
| 2015 | $846 | $32,215 | $5,100 | $27,115 |
| 2014 | $855 | $32,215 | $5,100 | $27,115 |
| 2013 | $870 | $32,215 | $5,100 | $27,115 |
Source: Public Records
Map
Nearby Homes
- 409 S Pine St
- 0 Ohio 67
- 201 E Pearl St
- 9 E Silver St
- 211 W Benton St
- 307 W Auglaize St
- 307 W Benton St
- 102 Wapak St
- 414 W Auglaize St
- 0 Wapakoneta Cridersville Rd
- 608 W Benton St
- 420 Hoopengarner St
- 322 Cole Dr
- 814 W Benton St
- 808 Aster Dr
- 106 Valleyview Dr
- 109 Bluegrass Dr
- 906 Aster Dr
- 1100 W Auglaize St