Estimated Value: $356,619 - $382,000
3
Beds
2
Baths
1,806
Sq Ft
$206/Sq Ft
Est. Value
About This Home
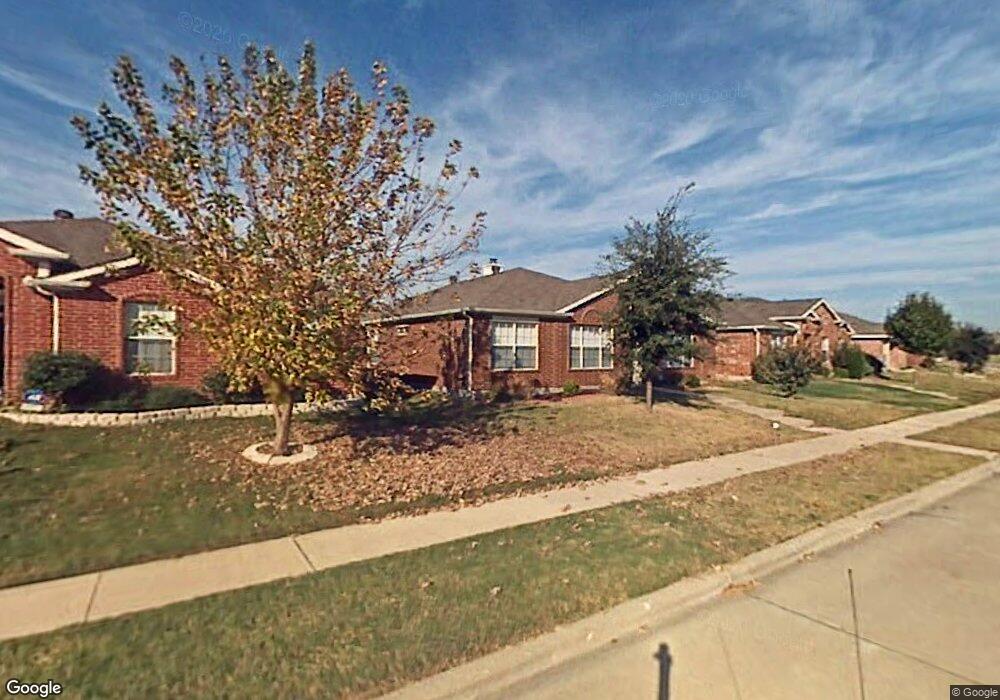
This home is located at 303 Cobblestone Dr, Wylie, TX 75098 and is currently estimated at $372,155, approximately $206 per square foot. 303 Cobblestone Dr is a home located in Collin County with nearby schools including R V Groves Elementary School, Dr. Al Draper Intermediate Middle School, and Raymond B Cooper J High School.
Ownership History
Date
Name
Owned For
Owner Type
Purchase Details
Closed on
Dec 17, 2010
Sold by
Quiros Leslie
Bought by
Cornillault Matthieu
Current Estimated Value
Purchase Details
Closed on
Nov 6, 2006
Sold by
Williams Franky T and Williams Carol R
Bought by
Quiros Leslie
Home Financials for this Owner
Home Financials are based on the most recent Mortgage that was taken out on this home.
Original Mortgage
$91,900
Interest Rate
7.62%
Mortgage Type
Purchase Money Mortgage
Purchase Details
Closed on
Jul 6, 2001
Sold by
Pulte Homes Of Texas Lp
Bought by
Williams Franky T and Williams Carol R
Home Financials for this Owner
Home Financials are based on the most recent Mortgage that was taken out on this home.
Original Mortgage
$141,350
Interest Rate
7.18%
Mortgage Type
FHA
Create a Home Valuation Report for This Property
The Home Valuation Report is an in-depth analysis detailing your home's value as well as a comparison with similar homes in the area
Home Values in the Area
Average Home Value in this Area
Purchase History
| Date | Buyer | Sale Price | Title Company |
|---|---|---|---|
| Cornillault Matthieu | -- | Hexter Fair Title Company | |
| Quiros Leslie | -- | Ctic | |
| Williams Franky T | -- | -- |
Source: Public Records
Mortgage History
| Date | Status | Borrower | Loan Amount |
|---|---|---|---|
| Previous Owner | Quiros Leslie | $91,900 | |
| Previous Owner | Williams Franky T | $141,350 |
Source: Public Records
Tax History Compared to Growth
Tax History
| Year | Tax Paid | Tax Assessment Tax Assessment Total Assessment is a certain percentage of the fair market value that is determined by local assessors to be the total taxable value of land and additions on the property. | Land | Improvement |
|---|---|---|---|---|
| 2025 | $6,742 | $387,954 | $95,000 | $292,954 |
| 2024 | $6,742 | $354,837 | $95,000 | $246,369 |
| 2023 | $6,742 | $335,649 | $95,000 | $240,649 |
| 2022 | $6,724 | $306,490 | $75,000 | $231,490 |
| 2021 | $5,818 | $247,284 | $55,000 | $192,284 |
| 2020 | $5,607 | $225,811 | $55,000 | $170,811 |
| 2019 | $6,183 | $235,301 | $55,000 | $180,301 |
| 2018 | $5,922 | $219,883 | $55,000 | $164,883 |
| 2017 | $5,523 | $205,090 | $50,000 | $155,090 |
| 2016 | $4,687 | $168,700 | $40,000 | $128,700 |
| 2015 | $3,779 | $150,701 | $35,000 | $115,701 |
Source: Public Records
Map
Nearby Homes
- 3006 Springwell Pkwy
- 206 Grassy Creek Dr
- 3103 Creekwood Dr
- Iris Plan at Wooded Creek
- Beckett II Plan at Wooded Creek
- Annabelle III Plan at Wooded Creek
- 3017 Eagle Mountain Dr
- 3003 Candlebrook Dr
- 208 Lakefront Dr
- 3111 Candlebrook Dr
- 2722 W Fm 544
- 2606 Parkbridge Ct
- 301 Creekview Dr
- 207 Creekview Dr
- 310 Admiral Dr
- 3105 Admiral Dr
- 2615 Gum Tree Trail
- 307 Wooded Creek Ave
- 2710 W Fm 544
- 3203 Amber Waves Ln
- 305 Cobblestone Dr
- 301 Cobblestone Dr
- 307 Cobblestone Dr
- 207 Cobblestone Dr
- 302 Springwell Pkwy
- 300 Springwell Pkwy
- 309 Cobblestone Dr
- 205 Cobblestone Dr
- 304 Springwell Pkwy
- 302 Cobblestone Dr
- 300 Cobblestone Dr
- 208 Springwell Pkwy
- 304 Cobblestone Dr
- 208 Cobblestone Dr
- 306 Springwell Pkwy
- 203 Cobblestone Dr
- 206 Cobblestone Dr
- 306 Cobblestone Dr
- 206 Springwell Pkwy
- 204 Cobblestone Dr