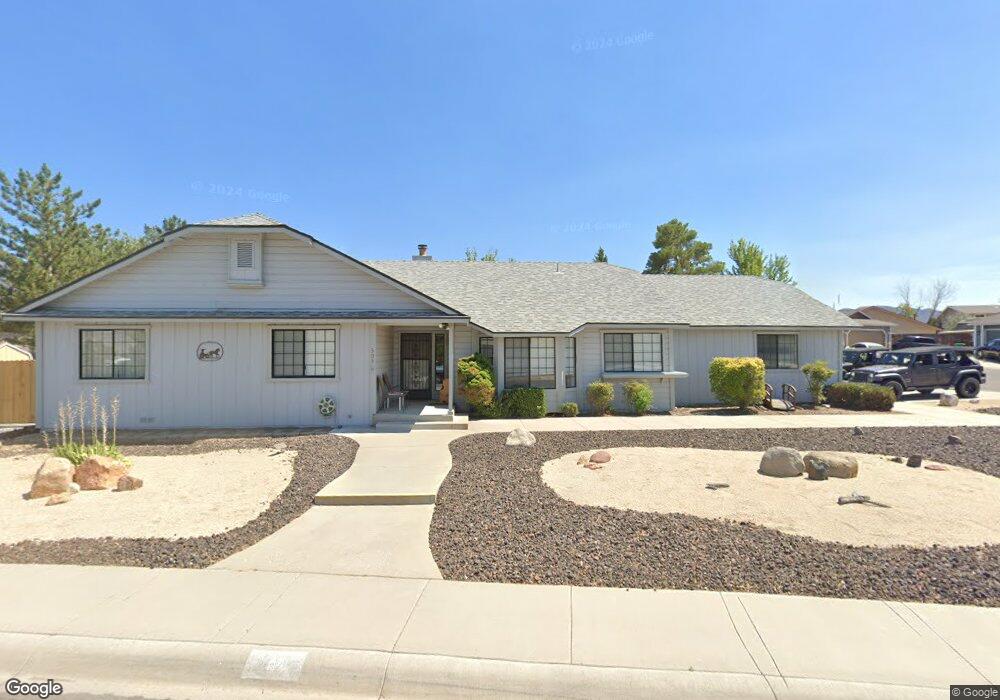
303 Coral Way Unit 3B Dayton, NV 89403
Estimated Value: $464,837 - $489,000
4
Beds
2
Baths
2,018
Sq Ft
$237/Sq Ft
Est. Value
About This Home
This home is located at 303 Coral Way Unit 3B, Dayton, NV 89403 and is currently estimated at $478,209, approximately $236 per square foot. 303 Coral Way Unit 3B is a home located in Lyon County with nearby schools including Dayton Elementary School, Dayton Intermediate School, and Dayton High School.
Ownership History
Date
Name
Owned For
Owner Type
Purchase Details
Closed on
Jul 25, 2022
Sold by
Frink Family Trust
Bought by
Brewer Laurie and Brewer Dana
Current Estimated Value
Home Financials for this Owner
Home Financials are based on the most recent Mortgage that was taken out on this home.
Original Mortgage
$253,800
Outstanding Balance
$241,752
Interest Rate
5.23%
Mortgage Type
New Conventional
Estimated Equity
$236,457
Purchase Details
Closed on
Jan 8, 2014
Sold by
Frink Lynn and Frink Betty
Bought by
Frink Lynn and Frink Family Trust Agreement
Purchase Details
Closed on
Aug 19, 2010
Sold by
Huber Donna Dianne
Bought by
Frink Lynn N and Frink Betty J
Home Financials for this Owner
Home Financials are based on the most recent Mortgage that was taken out on this home.
Original Mortgage
$157,874
Interest Rate
4.75%
Mortgage Type
FHA
Create a Home Valuation Report for This Property
The Home Valuation Report is an in-depth analysis detailing your home's value as well as a comparison with similar homes in the area
Home Values in the Area
Average Home Value in this Area
Purchase History
| Date | Buyer | Sale Price | Title Company |
|---|---|---|---|
| Brewer Laurie | $460,000 | Mikrut Denise | |
| Frink Lynn | -- | None Available | |
| Frink Lynn N | $160,000 | Northern Nevada Title Cc |
Source: Public Records
Mortgage History
| Date | Status | Borrower | Loan Amount |
|---|---|---|---|
| Open | Brewer Laurie | $253,800 | |
| Previous Owner | Frink Lynn N | $157,874 |
Source: Public Records
Tax History Compared to Growth
Tax History
| Year | Tax Paid | Tax Assessment Tax Assessment Total Assessment is a certain percentage of the fair market value that is determined by local assessors to be the total taxable value of land and additions on the property. | Land | Improvement |
|---|---|---|---|---|
| 2025 | $2,134 | $128,379 | $73,500 | $54,879 |
| 2024 | $2,072 | $129,323 | $73,500 | $55,822 |
| 2023 | $2,072 | $126,316 | $73,500 | $52,816 |
| 2022 | $1,508 | $122,880 | $73,500 | $49,380 |
| 2021 | $1,464 | $108,074 | $59,500 | $48,574 |
| 2020 | $1,420 | $106,303 | $59,500 | $46,803 |
| 2019 | $1,379 | $93,310 | $47,950 | $45,360 |
| 2018 | $1,339 | $76,173 | $31,500 | $44,673 |
| 2017 | $1,300 | $57,587 | $12,600 | $44,987 |
| 2016 | $1,267 | $53,232 | $6,300 | $46,932 |
| 2015 | $1,264 | $42,772 | $6,300 | $36,472 |
| 2014 | $1,228 | $38,452 | $6,300 | $32,152 |
Source: Public Records
Map
Nearby Homes
- 313 Stillwater Dr
- 303 Stillwater Dr
- 325 Stillwater Dr
- 502 Pebble Ct
- 329 Stillwater Dr
- 706 Sunset Way
- 168 River Village Cir Unit 2A
- 183 Deerfield Rd
- 143 Wentworth Cir
- 262 Cruden Bay Dr
- 504 Doral Ct
- 155 Hall St
- 400 Pebble Beach Ct
- 405 Cypress Ct
- 349 Bayhill Cir Unit 2
- 357 Bayhill Cir
- 207 Doolittle Ct
- 363 Bayhill Cir
- 401 Valley View Ct
- 111 Augusta Ct
- 305 Coral Way
- 301 Coral Way
- 307 Coral Way Unit 1
- 307 Coral Way
- 302 Stillwater Dr
- 302 Coral Way
- 300 Stillwater Dr
- 304 Stillwater Dr
- 308 Coral Way
- 309 Coral Way
- 310 Coral Way
- 304 Coral Way
- 306 Coral Way
- 308 Stillwater Dr
- 306 Stillwater Dr
- 404 Channel Dr
- 310 Stillwater Dr
- 109 Pebble Dr
- 406 Channel Dr
- 111 Pebble Dr