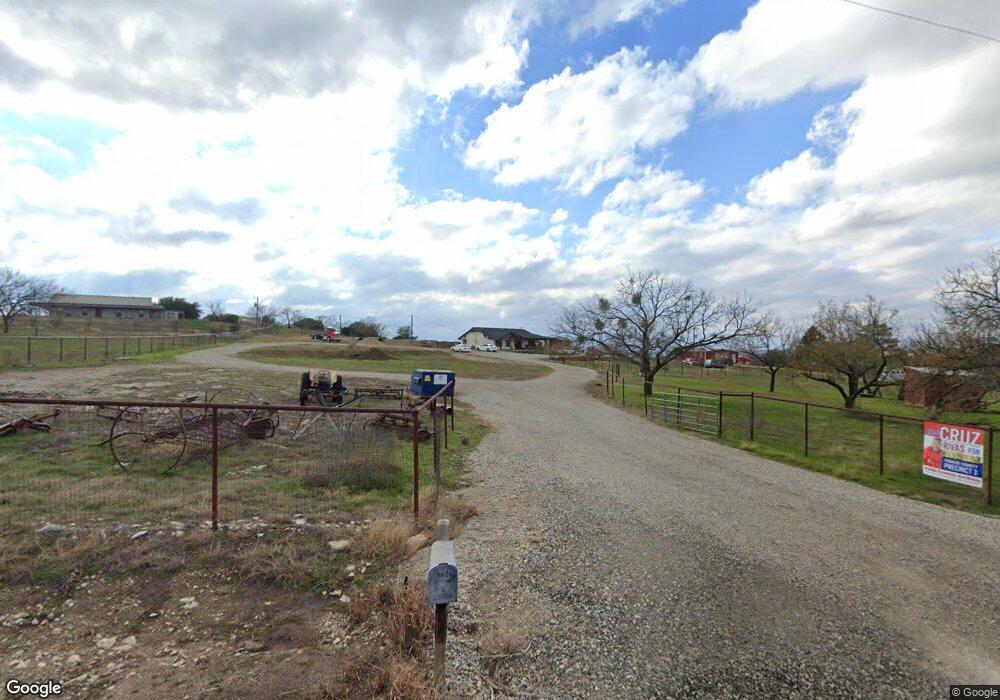
303 Country Place Rd Weatherford, TX 76087
Estimated Value: $366,000 - $504,899
4
Beds
2
Baths
1,607
Sq Ft
$265/Sq Ft
Est. Value
About This Home
This home is located at 303 Country Place Rd, Weatherford, TX 76087 and is currently estimated at $425,475, approximately $264 per square foot. 303 Country Place Rd is a home located in Parker County with nearby schools including Brock Intermediate School, Brock Junior High School, and Brock High School.
Ownership History
Date
Name
Owned For
Owner Type
Purchase Details
Closed on
Jun 11, 2020
Sold by
Wise Troy J
Bought by
Wise Troy J and Wise Kimberl Y
Current Estimated Value
Purchase Details
Closed on
Nov 6, 2017
Sold by
Wise Nicole D
Bought by
Wise Troy J
Home Financials for this Owner
Home Financials are based on the most recent Mortgage that was taken out on this home.
Original Mortgage
$177,299
Outstanding Balance
$149,615
Interest Rate
4.12%
Mortgage Type
FHA
Estimated Equity
$275,860
Purchase Details
Closed on
Jun 4, 2014
Sold by
Rodriguez David Ray and Rodriguez Cheryl Jean
Bought by
Wise Troy J and Wise Nicole D
Home Financials for this Owner
Home Financials are based on the most recent Mortgage that was taken out on this home.
Original Mortgage
$171,428
Interest Rate
4.38%
Mortgage Type
New Conventional
Purchase Details
Closed on
May 8, 2009
Sold by
Rodriguez David Ray and Rodriguez Cheryl Jean
Bought by
Revoca David Ray and Revoca Cheryl Jean Rodriguez
Create a Home Valuation Report for This Property
The Home Valuation Report is an in-depth analysis detailing your home's value as well as a comparison with similar homes in the area
Home Values in the Area
Average Home Value in this Area
Purchase History
| Date | Buyer | Sale Price | Title Company |
|---|---|---|---|
| Wise Troy J | -- | None Available | |
| Wise Troy J | -- | None Available | |
| Wise Troy J | -- | Stewart | |
| Revoca David Ray | -- | None Available |
Source: Public Records
Mortgage History
| Date | Status | Borrower | Loan Amount |
|---|---|---|---|
| Open | Wise Troy J | $177,299 | |
| Closed | Wise Troy J | $171,428 |
Source: Public Records
Tax History Compared to Growth
Tax History
| Year | Tax Paid | Tax Assessment Tax Assessment Total Assessment is a certain percentage of the fair market value that is determined by local assessors to be the total taxable value of land and additions on the property. | Land | Improvement |
|---|---|---|---|---|
| 2025 | $1,802 | $375,040 | $173,970 | $201,070 |
| 2024 | $1,802 | $402,061 | -- | -- |
| 2023 | $1,802 | $365,510 | $0 | $0 |
| 2022 | $6,746 | $332,290 | $121,110 | $211,180 |
| 2021 | $7,094 | $332,290 | $121,110 | $211,180 |
| 2020 | $5,206 | $240,520 | $81,440 | $159,080 |
| 2019 | $5,118 | $240,520 | $81,440 | $159,080 |
| 2018 | $4,674 | $210,660 | $57,710 | $152,950 |
| 2017 | $4,176 | $210,660 | $57,710 | $152,950 |
| 2016 | $3,796 | $165,000 | $47,150 | $117,850 |
| 2015 | $3,171 | $165,000 | $47,150 | $117,850 |
| 2014 | -- | $158,220 | $45,780 | $112,440 |
Source: Public Records
Map
Nearby Homes
- 000 Dennis Rd
- 103 Patrick Creek Rd
- 121 Dan Russell Bend
- 805 Purselley Pass
- 801 Purselley Pass
- TBA Old Brock Rd
- 724 Cooper Trail
- 200 Dan Russell Bend
- 393 Canyon Creek Cir
- 400 Timber Wild Dr
- 313 Canyon Creek Cir
- 621 Hondo Crossing
- 101 Pharris Ct
- 617 Hondo Crossing
- 613 Hondo Crossing
- 150 Top Flight Dr
- 151 Canyon Creek Ct
- 1051 Kingsley Ct
- 205 Pinnacle Peak Ln
- 1060 Kessler Rd
- 313 Country Place Rd
- 2688 Dennis Rd
- 317 Country Place Rd
- 300 Country Place Rd
- 0000 Dennis Rd
- TBD1A Dennis Rd
- 01 Dennis Rd
- TBD Dennis Rd
- 2710 Dennis Rd
- 310 Country Place Rd
- 0 Tbd Dennis Rd
- 2724 Dennis Rd
- 300 Patrick Creek Rd Unit ROAD
- 300 Patrick Creek Rd
- 339 Country Place Rd
- 339 Country Place Rd Unit ROAD
- Lot 2 Patrick Creek Rd
- Lot 1 Patrick Creek Rd
- 330 Country Place Rd
- 2507 Dennis Rd