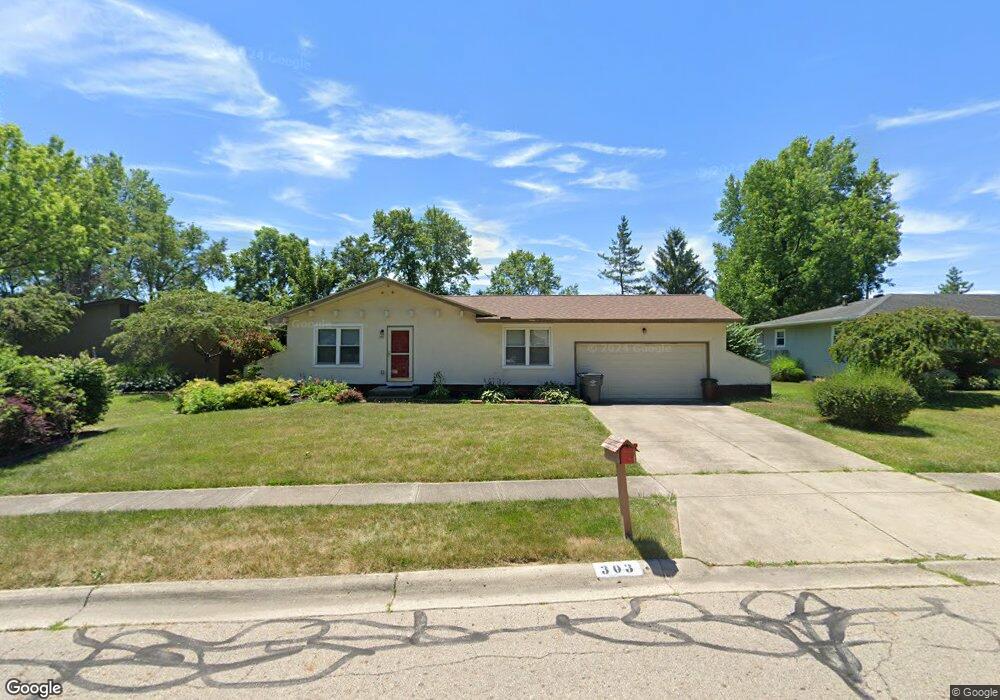
303 Denison Ave Columbus, OH 43230
Gahanna-Havens Corners NeighborhoodEstimated Value: $286,000 - $339,000
3
Beds
2
Baths
1,344
Sq Ft
$232/Sq Ft
Est. Value
About This Home
This home is located at 303 Denison Ave, Columbus, OH 43230 and is currently estimated at $311,750, approximately $231 per square foot. 303 Denison Ave is a home located in Franklin County with nearby schools including Goshen Lane Elementary School, Gahanna West Middle School, and Lincoln High School.
Ownership History
Date
Name
Owned For
Owner Type
Purchase Details
Closed on
Sep 6, 2018
Sold by
Vavrek Susan M and Vavrek Jospeh Roger
Bought by
Walton Anne Lopez
Current Estimated Value
Home Financials for this Owner
Home Financials are based on the most recent Mortgage that was taken out on this home.
Original Mortgage
$156,600
Outstanding Balance
$135,453
Interest Rate
4.6%
Mortgage Type
New Conventional
Estimated Equity
$176,297
Purchase Details
Closed on
Mar 3, 2009
Sold by
Vavrek Susan S and Vavrek Joseph Roger
Bought by
Vavrek Susan M and Vavrek Joseph Roger
Home Financials for this Owner
Home Financials are based on the most recent Mortgage that was taken out on this home.
Original Mortgage
$88,000
Interest Rate
5.09%
Mortgage Type
Purchase Money Mortgage
Purchase Details
Closed on
May 30, 1972
Bought by
Stevens Mary A
Create a Home Valuation Report for This Property
The Home Valuation Report is an in-depth analysis detailing your home's value as well as a comparison with similar homes in the area
Home Values in the Area
Average Home Value in this Area
Purchase History
| Date | Buyer | Sale Price | Title Company |
|---|---|---|---|
| Walton Anne Lopez | $174,000 | First American Title Ins | |
| Vavrek Susan M | $88,000 | Amerititle | |
| Stevens Mary A | -- | -- |
Source: Public Records
Mortgage History
| Date | Status | Borrower | Loan Amount |
|---|---|---|---|
| Open | Walton Anne Lopez | $156,600 | |
| Previous Owner | Vavrek Susan M | $88,000 |
Source: Public Records
Tax History
| Year | Tax Paid | Tax Assessment Tax Assessment Total Assessment is a certain percentage of the fair market value that is determined by local assessors to be the total taxable value of land and additions on the property. | Land | Improvement |
|---|---|---|---|---|
| 2025 | $5,235 | $88,870 | $33,360 | $55,510 |
| 2024 | $5,235 | $88,870 | $33,360 | $55,510 |
| 2023 | $5,170 | $88,870 | $33,360 | $55,510 |
| 2022 | $4,444 | $59,510 | $15,860 | $43,650 |
| 2021 | $4,298 | $59,510 | $15,860 | $43,650 |
| 2020 | $4,262 | $59,510 | $15,860 | $43,650 |
| 2019 | $3,550 | $49,460 | $13,200 | $36,260 |
| 2018 | $2,577 | $47,050 | $13,200 | $33,850 |
| 2017 | $2,523 | $47,050 | $13,200 | $33,850 |
| 2016 | $2,423 | $42,250 | $12,920 | $29,330 |
| 2015 | $2,425 | $42,250 | $12,920 | $29,330 |
| 2014 | $2,406 | $42,250 | $12,920 | $29,330 |
| 2013 | $1,195 | $42,245 | $12,915 | $29,330 |
Source: Public Records
Map
Nearby Homes
- 402 Citadel St
- 300 Dunbarton Rd
- 167 Lansdowne Ave
- 258 Rocky Fork Dr S
- 329 Cliffview Dr
- 600 Agler Rd
- 309 Broken Arrow Rd
- 2876 Johnstown Rd
- 3832 Emmons Ave
- 0 E Emmons Ave
- 169 Flint Ridge Dr
- 140 Walnut St
- 2225 Mifflin Blvd
- 0 E Minnesota Ave Unit 224018641
- 0 E Aberdeen Ave Unit 226006710
- 1822 Stelzer Rd
- 3756 Genessee Ave
- 278 Empire Dr
- 309 Baroness Way
- 221 Lincolnshire Rd
- 307 Denison Ave
- 431 Citadel St
- 315 Denison Ave
- 417 Citadel St
- 316 Denison Ave
- 323 Denison Ave
- 426 Citadel St
- 409 Citadel St
- 434 Citadel St
- 418 Citadel St
- 410 Citadel St
- 320 Denison Ave
- 331 Denison Ave
- 401 Citadel St
- 425 Xavier St
- 417 Xavier St
- 433 Xavier St
- 324 Denison Ct
- 339 Denison Ave
- 411 Xavier St
Your Personal Tour Guide
Ask me questions while you tour the home.