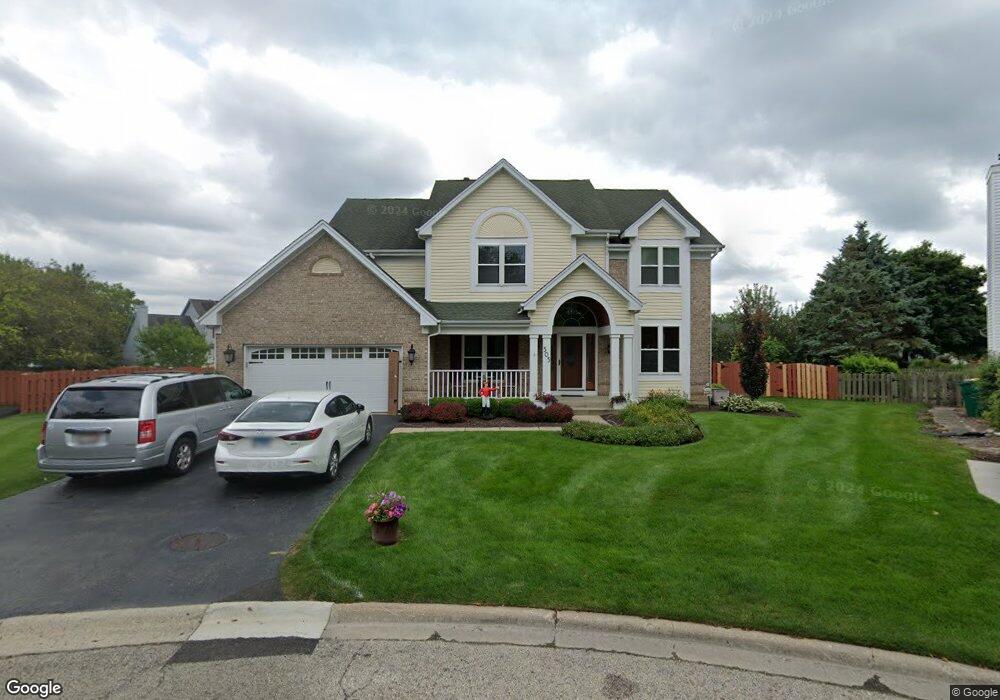
303 Devon Ct Grayslake, IL 60030
Estimated Value: $510,000 - $533,000
5
Beds
4
Baths
2,757
Sq Ft
$190/Sq Ft
Est. Value
About This Home
This home is located at 303 Devon Ct, Grayslake, IL 60030 and is currently estimated at $524,019, approximately $190 per square foot. 303 Devon Ct is a home located in Lake County with nearby schools including Woodland Primary School, Woodland Elementary School, and Woodland Intermediate School.
Ownership History
Date
Name
Owned For
Owner Type
Purchase Details
Closed on
Aug 24, 2007
Sold by
Cartus Financial Corp
Bought by
Danca Vincent M and Danca Amy L
Current Estimated Value
Home Financials for this Owner
Home Financials are based on the most recent Mortgage that was taken out on this home.
Original Mortgage
$312,000
Interest Rate
6.49%
Mortgage Type
Unknown
Purchase Details
Closed on
Jun 19, 2007
Sold by
Robinson William N and Robinson Julie K
Bought by
Cartus Financial Corp
Purchase Details
Closed on
Aug 20, 2001
Sold by
Inghram Thomas K
Bought by
Robinson William N and Robinson Julie K
Home Financials for this Owner
Home Financials are based on the most recent Mortgage that was taken out on this home.
Original Mortgage
$261,000
Interest Rate
6.99%
Purchase Details
Closed on
Aug 4, 1999
Sold by
Inghram Mary K
Bought by
Inghram Thomas K
Home Financials for this Owner
Home Financials are based on the most recent Mortgage that was taken out on this home.
Original Mortgage
$216,100
Interest Rate
6.75%
Create a Home Valuation Report for This Property
The Home Valuation Report is an in-depth analysis detailing your home's value as well as a comparison with similar homes in the area
Home Values in the Area
Average Home Value in this Area
Purchase History
| Date | Buyer | Sale Price | Title Company |
|---|---|---|---|
| Danca Vincent M | $352,000 | Burnet Title | |
| Cartus Financial Corp | $370,000 | Burnet Title | |
| Robinson William N | $290,000 | -- | |
| Inghram Thomas K | -- | -- |
Source: Public Records
Mortgage History
| Date | Status | Borrower | Loan Amount |
|---|---|---|---|
| Previous Owner | Danca Vincent M | $312,000 | |
| Previous Owner | Robinson William N | $261,000 | |
| Previous Owner | Inghram Thomas K | $216,100 |
Source: Public Records
Tax History
| Year | Tax Paid | Tax Assessment Tax Assessment Total Assessment is a certain percentage of the fair market value that is determined by local assessors to be the total taxable value of land and additions on the property. | Land | Improvement |
|---|---|---|---|---|
| 2024 | $13,959 | $144,308 | $30,026 | $114,282 |
| 2023 | $12,397 | $132,441 | $27,557 | $104,884 |
| 2022 | $12,397 | $116,124 | $21,123 | $95,001 |
| 2021 | $12,216 | $111,615 | $20,303 | $91,312 |
| 2020 | $13,529 | $117,465 | $19,319 | $98,146 |
| 2019 | $13,033 | $112,698 | $18,535 | $94,163 |
| 2018 | $13,674 | $119,194 | $22,779 | $96,415 |
| 2017 | $13,548 | $112,119 | $21,427 | $90,692 |
| 2016 | $13,017 | $103,497 | $19,779 | $83,718 |
| 2015 | $12,522 | $94,553 | $18,070 | $76,483 |
| 2014 | $12,375 | $91,706 | $20,457 | $71,249 |
| 2012 | $12,276 | $95,777 | $21,365 | $74,412 |
Source: Public Records
Map
Nearby Homes
- 275 N Cambridge Ct
- 130 Whitehall Ct
- 204 Buckingham Dr
- 1172 Hummingbird Ln
- 248 Bobolink Dr
- 529 Shakespeare Dr
- 15010 W Belvidere Rd
- 860 Amelia Ct
- 831 Amelia Ct
- 842 Amelia Ct
- 354 Stevens Ct
- 673 Cardinal Ct
- 33077 N Sunset Ave
- 701 Caitlin Ct
- 556 Chard Ct
- 470 Ziegler Dr
- 545 Pheasant Ct
- 1544 Syracuse Dr
- 1117 Mckay Cir Unit D
- 33771 N 2nd St
- 311 Devon Ct
- 310 Devon Ct
- 230 Cambridge Dr
- 242 N Cambridge Ct
- 242 Cambridge Dr
- 318 Devon Ct
- 250 Cambridge Dr Unit 6
- 319 Devon Ct
- 262 Cambridge Dr
- 327 Devon Ct
- 330 Devon Ct
- 270 Cambridge Dr
- 258 Braxton Way
- 266 Braxton Way
- 335 Devon Ct Unit 6
- 250 Braxton Way
- 282 Cambridge Dr
- 274 Braxton Way
- 242 Braxton Way
- 306 Cambridge Dr
Your Personal Tour Guide
Ask me questions while you tour the home.