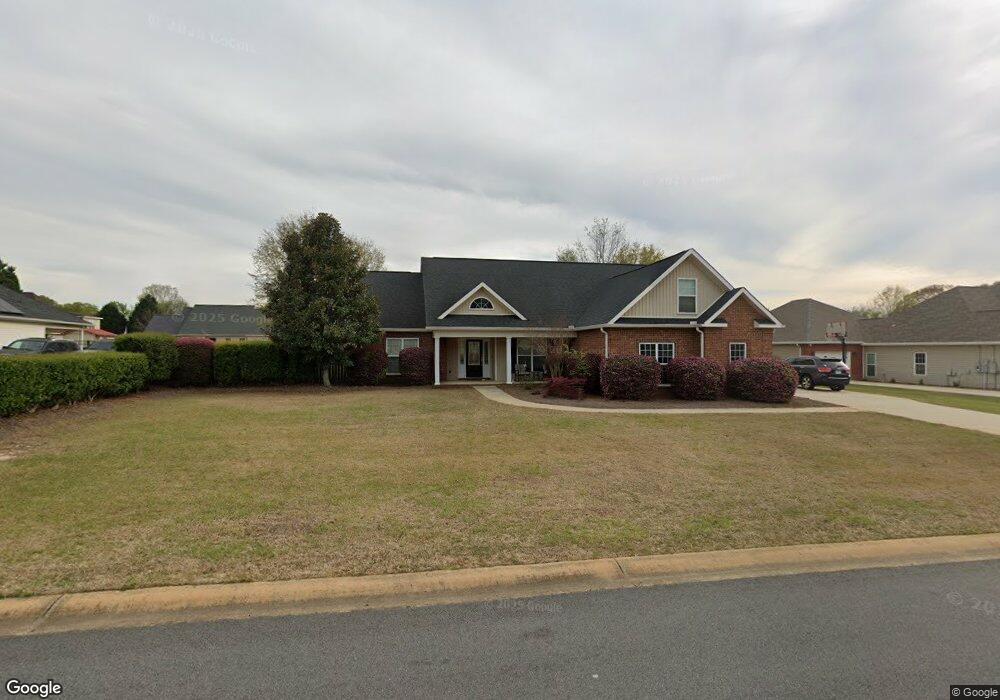
303 Durango Pass Warner Robins, GA 31088
Estimated Value: $296,406 - $316,000
4
Beds
2
Baths
2,080
Sq Ft
$148/Sq Ft
Est. Value
About This Home
This home is located at 303 Durango Pass, Warner Robins, GA 31088 and is currently estimated at $308,602, approximately $148 per square foot. 303 Durango Pass is a home located in Houston County with nearby schools including Lake Joy Primary School, Lake Joy Elementary School, and Mossy Creek Middle School.
Ownership History
Date
Name
Owned For
Owner Type
Purchase Details
Closed on
Mar 31, 2020
Sold by
Robbins James A and Robbins Jennifer L
Bought by
Maine Stacy B
Current Estimated Value
Home Financials for this Owner
Home Financials are based on the most recent Mortgage that was taken out on this home.
Original Mortgage
$201,286
Outstanding Balance
$178,315
Interest Rate
3.4%
Mortgage Type
FHA
Estimated Equity
$130,287
Purchase Details
Closed on
Apr 16, 2018
Sold by
Ingle Ty W
Bought by
Robbins James A and Robbins Jennifer L
Home Financials for this Owner
Home Financials are based on the most recent Mortgage that was taken out on this home.
Original Mortgage
$194,900
Interest Rate
4.44%
Mortgage Type
VA
Purchase Details
Closed on
Oct 17, 2007
Sold by
Wessex Homes Llc
Bought by
Ingle Ty W
Home Financials for this Owner
Home Financials are based on the most recent Mortgage that was taken out on this home.
Original Mortgage
$183,500
Interest Rate
6.26%
Mortgage Type
New Conventional
Purchase Details
Closed on
Nov 1, 2001
Sold by
Ncw Inc
Bought by
Wessex Homes Llc
Create a Home Valuation Report for This Property
The Home Valuation Report is an in-depth analysis detailing your home's value as well as a comparison with similar homes in the area
Home Values in the Area
Average Home Value in this Area
Purchase History
| Date | Buyer | Sale Price | Title Company |
|---|---|---|---|
| Maine Stacy B | $205,000 | None Available | |
| Robbins James A | $194,900 | None Available | |
| Ingle Ty W | $183,500 | None Available | |
| Wessex Homes Llc | -- | -- |
Source: Public Records
Mortgage History
| Date | Status | Borrower | Loan Amount |
|---|---|---|---|
| Open | Maine Stacy B | $201,286 | |
| Previous Owner | Robbins James A | $194,900 | |
| Previous Owner | Ingle Ty W | $183,500 |
Source: Public Records
Tax History
| Year | Tax Paid | Tax Assessment Tax Assessment Total Assessment is a certain percentage of the fair market value that is determined by local assessors to be the total taxable value of land and additions on the property. | Land | Improvement |
|---|---|---|---|---|
| 2024 | $2,246 | $93,880 | $10,800 | $83,080 |
| 2023 | $2,047 | $84,680 | $10,800 | $73,880 |
| 2022 | $2,018 | $83,480 | $10,800 | $72,680 |
| 2021 | $1,870 | $76,960 | $10,800 | $66,160 |
| 2020 | $1,737 | $73,160 | $8,400 | $64,760 |
| 2019 | $1,737 | $73,160 | $8,400 | $64,760 |
| 2018 | $1,679 | $68,800 | $8,400 | $60,400 |
| 2017 | $1,676 | $68,600 | $8,400 | $60,200 |
| 2016 | $1,726 | $70,520 | $8,400 | $62,120 |
| 2015 | $1,729 | $70,520 | $8,400 | $62,120 |
| 2014 | -- | $70,520 | $8,400 | $62,120 |
| 2013 | -- | $70,520 | $8,400 | $62,120 |
Source: Public Records
Map
Nearby Homes
- 229 Santa fe Trail
- 167 Holly Pointe
- 166 Holly Pointe
- 158 Holly Pointe
- 536 Childers Dr
- 202 Avondale Cir
- 600 Post Oak Way
- 302 Erin Way
- 107 Rachael Ln
- 104 Crockett Ct
- 115 Lori Ln
- 103 Lawing Place
- 209 Flagler Way
- 104 Downshire Way
- 901 Falkirk Dr
- 208 Northumberland Way
- 510 Cheshire Dr
- 204 Bridgeway Dr
- 104 Bryce Dr
- 107 Rodney Dr
- 301 Durango Pass
- 305 Durango Pass
- 130 Holly Pointe
- 126 Holly Pointe
- 302 Durango Pass
- 221 Santa fe Trail
- 307 Durango Pass
- 304 Durango Pass
- 132 Holly Pointe
- 124 Holly Pointe
- 223 Santa fe Trail
- 306 Durango Pass
- 134 Holly Pointe
- 122 Holly Pointe
- 219 Santa fe Trail
- 309 Durango Pass
- 129 Holly Pointe
- 127 Holly Pointe
- 214 Santa fe Trail
- 227 Santa fe Trail
Your Personal Tour Guide
Ask me questions while you tour the home.