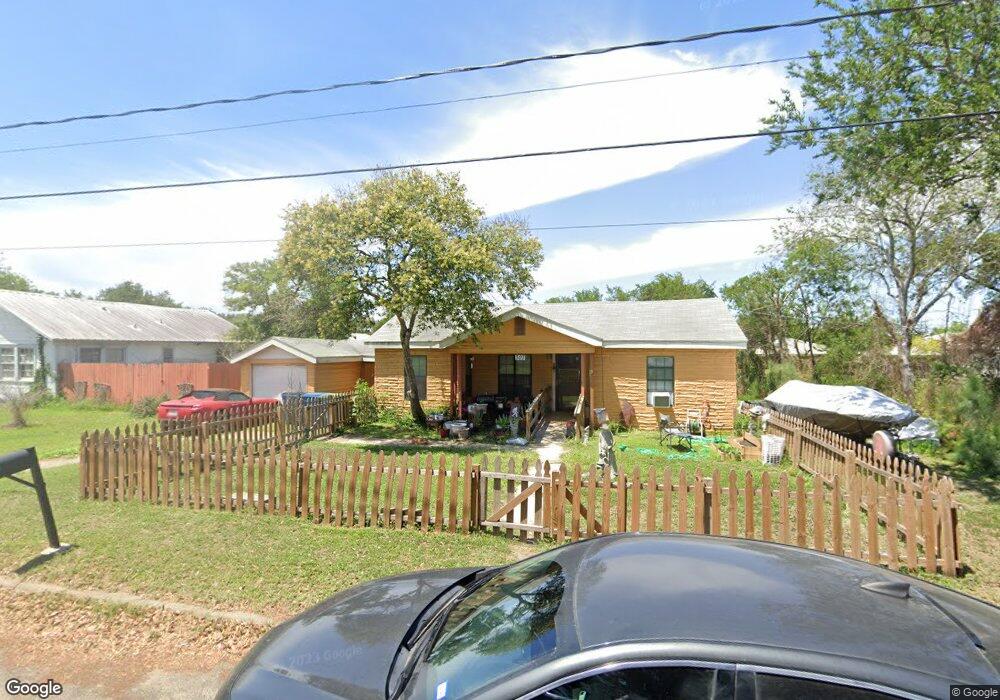
303 E Randall St Beeville, TX 78102
Estimated Value: $122,841 - $211,000
2
Beds
1
Bath
892
Sq Ft
$171/Sq Ft
Est. Value
About This Home
This home is located at 303 E Randall St, Beeville, TX 78102 and is currently estimated at $152,210, approximately $170 per square foot. 303 E Randall St is a home located in Bee County with nearby schools including A.C. Jones High School, St. Mary's Academy Charter School, and St. Philip's Episcopal School.
Ownership History
Date
Name
Owned For
Owner Type
Purchase Details
Closed on
Oct 7, 2021
Sold by
Kerr Jason P and Hazelton Paula M
Bought by
Brownell David Joseph
Current Estimated Value
Home Financials for this Owner
Home Financials are based on the most recent Mortgage that was taken out on this home.
Original Mortgage
$75,823
Interest Rate
3.05%
Mortgage Type
VA
Purchase Details
Closed on
May 25, 2016
Sold by
Gandhi Ranjitkumar and Gandhi Hemlata
Bought by
Brownell David Joseph and Brownell Carol L
Home Financials for this Owner
Home Financials are based on the most recent Mortgage that was taken out on this home.
Original Mortgage
$80,000
Interest Rate
3.58%
Mortgage Type
Purchase Money Mortgage
Purchase Details
Closed on
Mar 31, 2005
Sold by
Keegahn Kathleen
Bought by
Gandi Ranjithkumar and Gandi Hemlata
Create a Home Valuation Report for This Property
The Home Valuation Report is an in-depth analysis detailing your home's value as well as a comparison with similar homes in the area
Purchase History
| Date | Buyer | Sale Price | Title Company |
|---|---|---|---|
| Brownell David Joseph | -- | None Available | |
| Brownell David Joseph | -- | Boone Central Title | |
| Gandi Ranjithkumar | -- | None Available |
Source: Public Records
Mortgage History
| Date | Status | Borrower | Loan Amount |
|---|---|---|---|
| Previous Owner | Brownell David Joseph | $75,823 | |
| Previous Owner | Brownell David Joseph | $80,000 |
Source: Public Records
Tax History
| Year | Tax Paid | Tax Assessment Tax Assessment Total Assessment is a certain percentage of the fair market value that is determined by local assessors to be the total taxable value of land and additions on the property. | Land | Improvement |
|---|---|---|---|---|
| 2025 | $1,185 | $124,200 | $14,060 | $110,140 |
| 2024 | $2,948 | $124,200 | $14,060 | $110,140 |
| 2023 | $2,705 | $124,200 | $14,060 | $110,140 |
| 2022 | $2,689 | $106,730 | $11,810 | $94,920 |
| 2021 | $2,311 | $92,300 | $6,750 | $85,550 |
| 2020 | $2,100 | $92,300 | $6,750 | $85,550 |
| 2019 | $1,829 | $84,000 | $6,750 | $77,250 |
| 2018 | -- | $82,050 | $6,750 | $75,300 |
| 2017 | $1,400 | $81,480 | $6,750 | $74,730 |
| 2016 | $1,273 | $51,240 | $6,750 | $44,490 |
| 2015 | -- | $51,240 | $6,750 | $44,490 |
| 2014 | -- | $47,980 | $6,750 | $41,230 |
Source: Public Records
Map
Nearby Homes
- 400 E Randall St
- 1504 N Adams St
- 1309 N Adams St
- 501 E Randall St
- 1402 N Tyler St
- 1107 N Adams St
- 1804 N Mckinley St
- 706 E Inez St
- 1101 N Saint Marys St
- 1711 N Washington St
- 1506 North Ave E
- 1210 N Polk St
- 1701 North Ave E
- 801 E Fannin St
- 906 N Jefferson St
- 806 N Adams St
- 0000 W Inez St
- 803 N Buchanan St
- 1106 N Berry St
- 811 N Adams St
- 301 E Randall St
- 1503 N Adams St
- 300 E Randall St
- 1506 N Buchanan St
- 304 E Randall St
- 1501 N Adams St
- 308 E Randall St
- 201 E Randall St
- 306 E Inez St
- 1409 N Buchanan St
- 203 E Randall St
- 401 E Randall St
- 311 E Huntington St
- 210 E Randall St
- 206 E Inez St
- 301 E Huntington St
- 205 E Randall St
- 207 E Huntington St
- 305 E Inez St
- 301 E Inez St
Your Personal Tour Guide
Ask me questions while you tour the home.