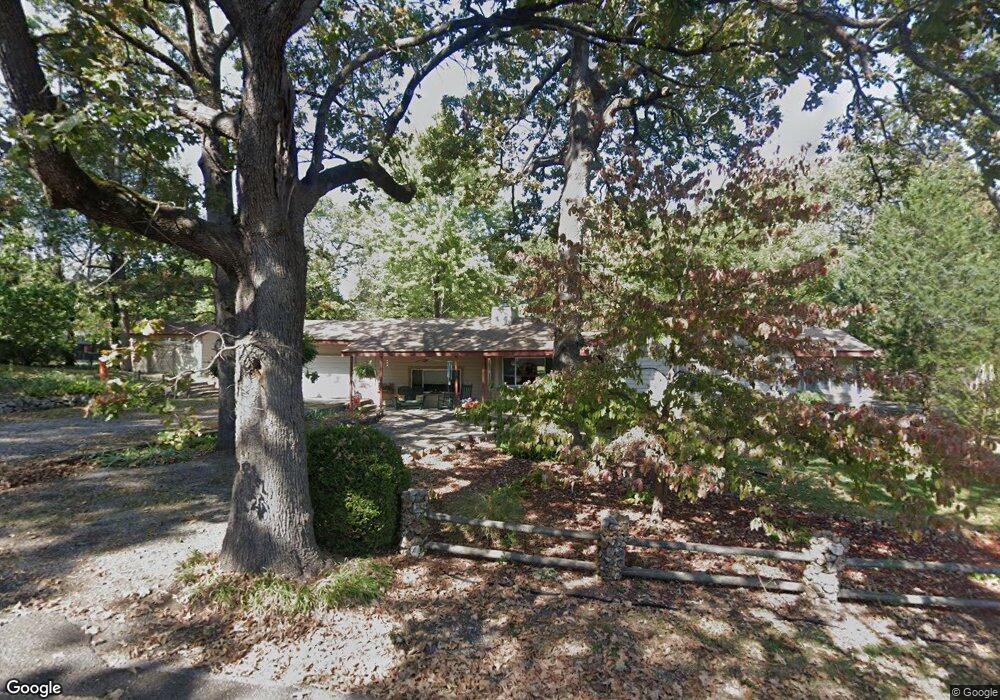
303 E Seneca St Tahlequah, OK 74464
Estimated Value: $183,878 - $222,000
3
Beds
2
Baths
1,756
Sq Ft
$115/Sq Ft
Est. Value
About This Home
This home is located at 303 E Seneca St, Tahlequah, OK 74464 and is currently estimated at $201,970, approximately $115 per square foot. 303 E Seneca St is a home located in Cherokee County with nearby schools including Cherokee Elementary School, Greenwood Elementary School, and Tahlequah Middle School.
Ownership History
Date
Name
Owned For
Owner Type
Purchase Details
Closed on
Jul 24, 2015
Sold by
Feller Jeffrey D and Feller Theresa E
Bought by
Feller Theresa E and Feller Jeffrey D
Current Estimated Value
Home Financials for this Owner
Home Financials are based on the most recent Mortgage that was taken out on this home.
Original Mortgage
$65,000
Outstanding Balance
$25,385
Interest Rate
4.06%
Mortgage Type
New Conventional
Estimated Equity
$176,585
Purchase Details
Closed on
Dec 21, 2000
Sold by
Jeffrey D Feller
Bought by
Jeffrey and Theresa Feller
Purchase Details
Closed on
Nov 30, 2000
Sold by
Lois and Walter Choate
Bought by
Jeffrey D Feller
Purchase Details
Closed on
Jun 14, 2000
Sold by
Walter Lois E and Walter Choate
Bought by
Lois E Choate
Purchase Details
Closed on
Jul 14, 1999
Sold by
Catherine
Bought by
Lois E Chote
Create a Home Valuation Report for This Property
The Home Valuation Report is an in-depth analysis detailing your home's value as well as a comparison with similar homes in the area
Home Values in the Area
Average Home Value in this Area
Purchase History
| Date | Buyer | Sale Price | Title Company |
|---|---|---|---|
| Feller Theresa E | -- | None Available | |
| Jeffrey | -- | -- | |
| Jeffrey D Feller | $78,000 | -- | |
| Lois E Choate | -- | -- | |
| Lois E Chote | $60,000 | -- |
Source: Public Records
Mortgage History
| Date | Status | Borrower | Loan Amount |
|---|---|---|---|
| Open | Feller Theresa E | $65,000 |
Source: Public Records
Tax History Compared to Growth
Tax History
| Year | Tax Paid | Tax Assessment Tax Assessment Total Assessment is a certain percentage of the fair market value that is determined by local assessors to be the total taxable value of land and additions on the property. | Land | Improvement |
|---|---|---|---|---|
| 2025 | $843 | $9,843 | $872 | $8,971 |
| 2024 | $843 | $9,898 | $872 | $9,026 |
| 2023 | $843 | $12,831 | $707 | $12,124 |
| 2022 | $1,063 | $12,457 | $686 | $11,771 |
| 2021 | $1,033 | $12,094 | $666 | $11,428 |
| 2020 | $1,018 | $11,742 | $647 | $11,095 |
| 2019 | $977 | $11,400 | $628 | $10,772 |
| 2018 | $957 | $11,068 | $697 | $10,371 |
| 2017 | $925 | $10,745 | $689 | $10,056 |
| 2016 | $996 | $10,432 | $655 | $9,777 |
| 2015 | $932 | $9,935 | $681 | $9,254 |
| 2014 | $891 | $9,462 | $880 | $8,582 |
Source: Public Records
Map
Nearby Homes
- 425 E Seneca St
- 802 E Seneca St
- 112 W Allen Rd
- 2020 N Everly Dr
- 2021 N Everly Dr
- 2000 N Everly Dr
- 1930 N Everly Dr
- 2010 N Everly Dr
- 2030 N Everly Dr
- 2031 N Everly Dr
- 2040 N Everly Dr
- 707 Victor St
- 920 Francis Ave
- 717 N Oklahoma Ave
- 710 Victor St
- 1408 Trimble Ave
- 1406 Skipper Ave
- 310 York St
- 916 Coy Ave
- 640 N Oklahoma Ave