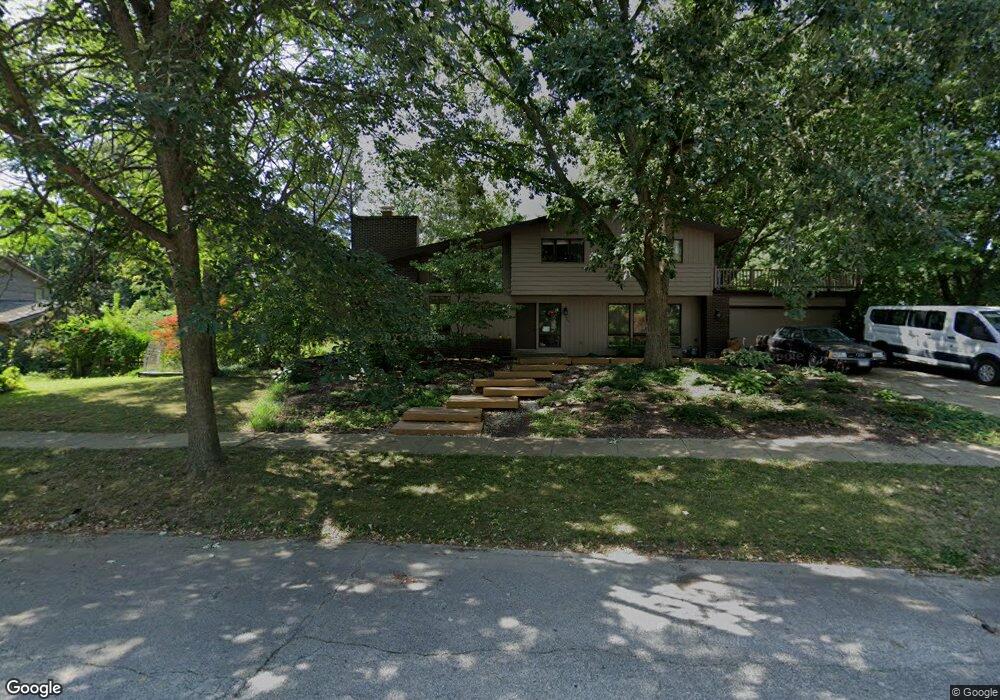
303 E Sherwin Cir Urbana, IL 61802
Southeast Urbana NeighborhoodEstimated Value: $393,000 - $645,000
3
Beds
3
Baths
1,180
Sq Ft
$422/Sq Ft
Est. Value
About This Home
This home is located at 303 E Sherwin Cir, Urbana, IL 61802 and is currently estimated at $497,725, approximately $421 per square foot. 303 E Sherwin Cir is a home located in Champaign County with nearby schools including Wiley Elementary School, Urbana Middle School, and Urbana High School.
Ownership History
Date
Name
Owned For
Owner Type
Purchase Details
Closed on
Nov 22, 2021
Sold by
Prochaska David and Holden Kathleen A
Bought by
Netter Molly K
Current Estimated Value
Purchase Details
Closed on
Oct 21, 2011
Sold by
Holden Kathleen Ann and Prochaska David
Bought by
Prochaska David and Holden Kathleen A
Purchase Details
Closed on
Jan 14, 2011
Sold by
Wunderli Lynn Ellen and Glenn Grandville Poor Jr Trust
Bought by
Holden Kathleen Ann
Home Financials for this Owner
Home Financials are based on the most recent Mortgage that was taken out on this home.
Original Mortgage
$184,000
Interest Rate
4.84%
Mortgage Type
New Conventional
Purchase Details
Closed on
Jan 14, 2009
Sold by
Poor Glen G and Poor Glenn Grandville
Bought by
Poor Glenn Grandville and Glenn Grandville Poor Jr Trust
Create a Home Valuation Report for This Property
The Home Valuation Report is an in-depth analysis detailing your home's value as well as a comparison with similar homes in the area
Home Values in the Area
Average Home Value in this Area
Purchase History
| Date | Buyer | Sale Price | Title Company |
|---|---|---|---|
| Netter Molly K | $439,000 | Act | |
| Prochaska David | -- | None Available | |
| Holden Kathleen Ann | $230,000 | None Available | |
| Poor Glenn Grandville | -- | None Available |
Source: Public Records
Mortgage History
| Date | Status | Borrower | Loan Amount |
|---|---|---|---|
| Previous Owner | Holden Kathleen Ann | $184,000 |
Source: Public Records
Tax History
| Year | Tax Paid | Tax Assessment Tax Assessment Total Assessment is a certain percentage of the fair market value that is determined by local assessors to be the total taxable value of land and additions on the property. | Land | Improvement |
|---|---|---|---|---|
| 2024 | $6,758 | $94,020 | $21,880 | $72,140 |
| 2023 | $6,758 | $88,950 | $20,700 | $68,250 |
| 2022 | $6,263 | $81,160 | $18,890 | $62,270 |
| 2021 | $5,495 | $76,860 | $17,890 | $58,970 |
| 2020 | $5,198 | $73,340 | $17,070 | $56,270 |
| 2019 | $5,051 | $73,340 | $17,070 | $56,270 |
| 2018 | $4,868 | $71,480 | $16,640 | $54,840 |
| 2017 | $4,943 | $69,940 | $16,280 | $53,660 |
| 2016 | $4,758 | $68,040 | $15,840 | $52,200 |
| 2015 | $4,681 | $66,450 | $15,470 | $50,980 |
| 2014 | $4,772 | $68,720 | $16,000 | $52,720 |
| 2013 | $4,984 | $72,490 | $16,880 | $55,610 |
Source: Public Records
Map
Nearby Homes
- 205 E Sherwin Cir
- 3503 S Deer Ridge Dr
- 506 E Scovill St
- 2308 Grange Dr
- 2313 S Anderson St
- 1611 E Vernon Dr
- 2810 Philo Rd
- 1709 E Horizon Ln
- 3202 Chatham Dr
- 3309 Memory Ln
- 1003 E Mchenry St
- 2730 Philo Rd
- 2107 S Zuppke Dr
- 1809 Galena St
- 1106 Mitchem Dr
- 1306 Silver St
- 1103 Brighton Dr
- 1105 Brighton Dr
- 2012 Vawter St
- 1004 E Harding Dr Unit 303
- 303 E Sherwin Cir
- 305 E Sherwin Cir
- 301 E Sherwin Cir
- 301 E Sherwin Cir Unit 1
- 207 E Sherwin Cir
- 207 E Sherwin Cir Unit 1
- 214 E Sherwin Dr
- 306 E Sherwin Cir
- 214 E Sherwin Dr
- 302 E Sherwin Cir
- 205 E Sherwin Cir Unit 1
- 210 E Sherwin Dr
- 210 E Sherwin Dr Unit 1
- 208 E Sherwin Cir
- 302 E Sherwin Dr
- 302 E Sherwin Dr
- 219 E Sherwin Dr
- 203 E Sherwin Cir
- 301 Pond Ridge Ln
- 206 E Sherwin Cir
Your Personal Tour Guide
Ask me questions while you tour the home.