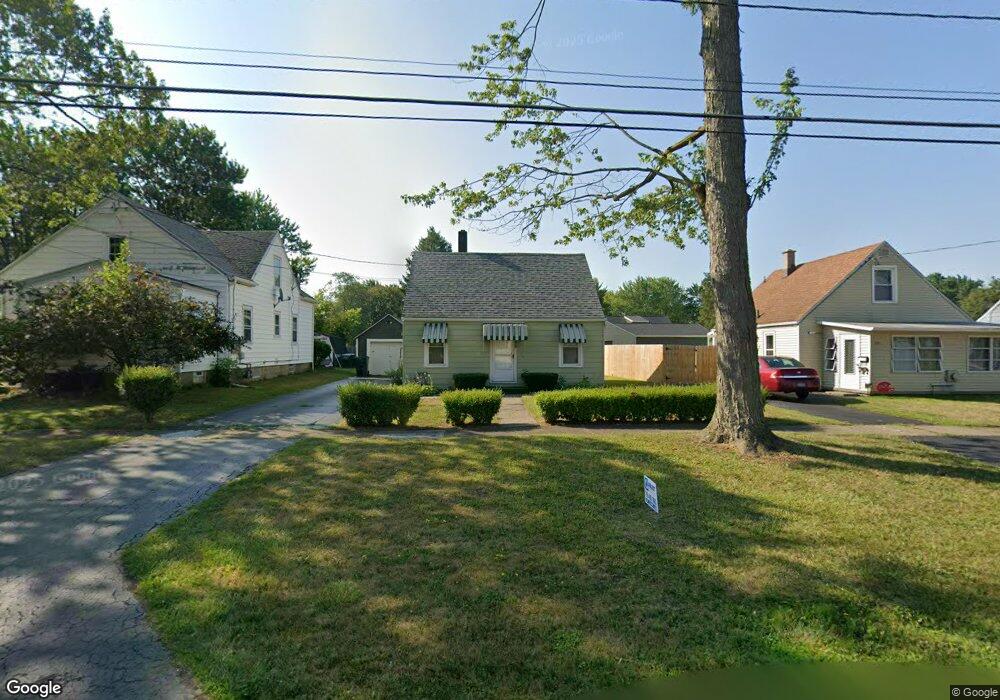
303 East Ave North Tonawanda, NY 14120
Estimated Value: $138,000 - $163,632
3
Beds
1
Bath
748
Sq Ft
$197/Sq Ft
Est. Value
About This Home
This home is located at 303 East Ave, North Tonawanda, NY 14120 and is currently estimated at $147,158, approximately $196 per square foot. 303 East Ave is a home located in Niagara County with nearby schools including North Tonawanda Intermediate School, St Matthew Lutheran School, and St. John Lutheran School.
Ownership History
Date
Name
Owned For
Owner Type
Purchase Details
Closed on
Jan 31, 2022
Sold by
Novosat Marie D
Bought by
Novosat Stephen J
Current Estimated Value
Home Financials for this Owner
Home Financials are based on the most recent Mortgage that was taken out on this home.
Original Mortgage
$86,400
Outstanding Balance
$79,903
Interest Rate
3.22%
Mortgage Type
New Conventional
Estimated Equity
$67,256
Purchase Details
Closed on
Jan 31, 2021
Sold by
Novosat Marie D
Bought by
Novosat Stephen J
Home Financials for this Owner
Home Financials are based on the most recent Mortgage that was taken out on this home.
Original Mortgage
$86,400
Interest Rate
3.22%
Mortgage Type
New Conventional
Purchase Details
Closed on
Apr 11, 2006
Sold by
Novosat Steve
Bought by
Novosat Steve
Purchase Details
Closed on
Apr 10, 2006
Sold by
Novosat Steve and Novosat Estate
Bought by
Novosat Steve
Create a Home Valuation Report for This Property
The Home Valuation Report is an in-depth analysis detailing your home's value as well as a comparison with similar homes in the area
Home Values in the Area
Average Home Value in this Area
Purchase History
| Date | Buyer | Sale Price | Title Company |
|---|---|---|---|
| Novosat Stephen J | $108,000 | Chicago Title Insurance Co | |
| Novosat Stephen J | -- | Brick Brick & Elmer Pc | |
| Novosat Steve | -- | David Starkey | |
| Novosat Steve | -- | David Starkey |
Source: Public Records
Mortgage History
| Date | Status | Borrower | Loan Amount |
|---|---|---|---|
| Open | Novosat Stephen J | $86,400 | |
| Previous Owner | Novosat Stephen J | $86,400 |
Source: Public Records
Tax History Compared to Growth
Tax History
| Year | Tax Paid | Tax Assessment Tax Assessment Total Assessment is a certain percentage of the fair market value that is determined by local assessors to be the total taxable value of land and additions on the property. | Land | Improvement |
|---|---|---|---|---|
| 2024 | $2,362 | $66,900 | $12,700 | $54,200 |
| 2023 | $2,303 | $66,900 | $12,700 | $54,200 |
| 2022 | $2,245 | $66,900 | $12,700 | $54,200 |
| 2021 | $2,011 | $55,900 | $12,700 | $43,200 |
| 2020 | $503 | $55,900 | $12,700 | $43,200 |
| 2019 | $651 | $55,900 | $12,700 | $43,200 |
| 2018 | $494 | $55,900 | $12,700 | $43,200 |
| 2017 | $487 | $55,900 | $12,700 | $43,200 |
| 2016 | $465 | $55,900 | $12,700 | $43,200 |
| 2015 | -- | $55,900 | $12,700 | $43,200 |
| 2014 | -- | $55,900 | $12,700 | $43,200 |
Source: Public Records
Map
Nearby Homes