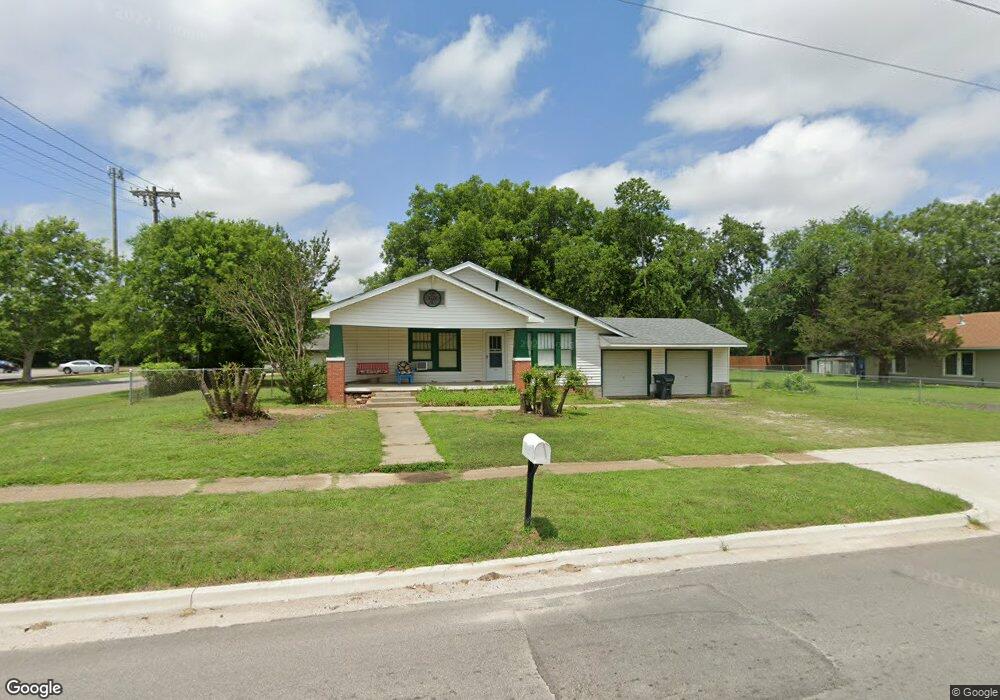
303 F St NE Ardmore, OK 73401
Estimated Value: $74,000 - $128,000
3
Beds
2
Baths
960
Sq Ft
$100/Sq Ft
Est. Value
About This Home
This home is located at 303 F St NE, Ardmore, OK 73401 and is currently estimated at $95,819, approximately $99 per square foot. 303 F St NE is a home located in Carter County with nearby schools including Jefferson Elementary School, Ardmore Middle School, and Ardmore High School.
Ownership History
Date
Name
Owned For
Owner Type
Purchase Details
Closed on
Nov 7, 2025
Sold by
Southers Bobbe and Southers James Edward
Bought by
Jackson Michael Rafe and Jackson Michelle Canton
Current Estimated Value
Purchase Details
Closed on
Apr 13, 2017
Sold by
Murray Investments Llc
Bought by
Wfb Investments Llc
Home Financials for this Owner
Home Financials are based on the most recent Mortgage that was taken out on this home.
Original Mortgage
$35,550
Interest Rate
4.1%
Mortgage Type
Purchase Money Mortgage
Purchase Details
Closed on
Sep 13, 2006
Sold by
Wallace Corra and Wallace Cora
Bought by
Murrey Investnments Properties Llc
Create a Home Valuation Report for This Property
The Home Valuation Report is an in-depth analysis detailing your home's value as well as a comparison with similar homes in the area
Home Values in the Area
Average Home Value in this Area
Purchase History
| Date | Buyer | Sale Price | Title Company |
|---|---|---|---|
| Jackson Michael Rafe | $78,500 | Arbuckle Closing & Escrow | |
| Wfb Investments Llc | $39,500 | None Available | |
| Murrey Investnments Properties Llc | $30,500 | -- |
Source: Public Records
Mortgage History
| Date | Status | Borrower | Loan Amount |
|---|---|---|---|
| Previous Owner | Wfb Investments Llc | $35,550 |
Source: Public Records
Tax History Compared to Growth
Tax History
| Year | Tax Paid | Tax Assessment Tax Assessment Total Assessment is a certain percentage of the fair market value that is determined by local assessors to be the total taxable value of land and additions on the property. | Land | Improvement |
|---|---|---|---|---|
| 2024 | $627 | $5,985 | $846 | $5,139 |
| 2023 | $597 | $5,700 | $836 | $4,864 |
| 2022 | $519 | $5,428 | $821 | $4,607 |
| 2021 | $522 | $5,171 | $789 | $4,382 |
| 2020 | $490 | $4,924 | $720 | $4,204 |
| 2019 | $478 | $4,925 | $720 | $4,205 |
| 2018 | $468 | $4,740 | $720 | $4,020 |
| 2017 | $428 | $4,682 | $684 | $3,998 |
| 2016 | $416 | $4,460 | $650 | $3,810 |
| 2015 | $326 | $4,247 | $201 | $4,046 |
| 2014 | $362 | $4,045 | $201 | $3,844 |
Source: Public Records
Map
Nearby Homes