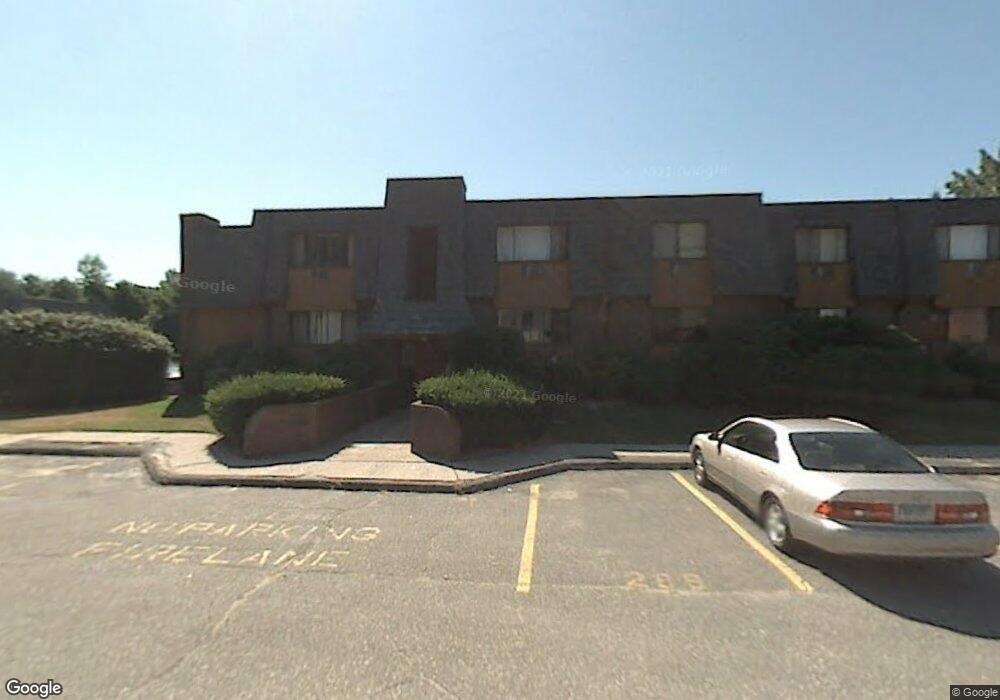
303 High Path Rd Unit 303 Windsor, CT 06095
West Windsor NeighborhoodEstimated Value: $128,000 - $175,000
2
Beds
2
Baths
961
Sq Ft
$168/Sq Ft
Est. Value
About This Home
This home is located at 303 High Path Rd Unit 303, Windsor, CT 06095 and is currently estimated at $161,726, approximately $168 per square foot. 303 High Path Rd Unit 303 is a home located in Hartford County with nearby schools including Oliver Ellsworth School, John F. Kennedy School, and Sage Park Middle School.
Ownership History
Date
Name
Owned For
Owner Type
Purchase Details
Closed on
Aug 28, 2007
Sold by
Jp Morgan Chase Bank
Bought by
Wilson Verna
Current Estimated Value
Home Financials for this Owner
Home Financials are based on the most recent Mortgage that was taken out on this home.
Original Mortgage
$80,700
Interest Rate
6.78%
Mortgage Type
Purchase Money Mortgage
Purchase Details
Closed on
Feb 3, 2004
Sold by
Thompson Linda
Bought by
Hatzidakis Spyridon and Hatzidakis Debra Crockett
Home Financials for this Owner
Home Financials are based on the most recent Mortgage that was taken out on this home.
Original Mortgage
$76,800
Interest Rate
8.62%
Mortgage Type
Purchase Money Mortgage
Purchase Details
Closed on
Apr 16, 2001
Sold by
Levesque Randall and Levesque Deborah
Bought by
Thompson Linda
Purchase Details
Closed on
Nov 25, 1992
Sold by
Citicorp Mtg
Bought by
Levesque Randall and Levesque Deborah
Create a Home Valuation Report for This Property
The Home Valuation Report is an in-depth analysis detailing your home's value as well as a comparison with similar homes in the area
Home Values in the Area
Average Home Value in this Area
Purchase History
| Date | Buyer | Sale Price | Title Company |
|---|---|---|---|
| Wilson Verna | $85,000 | -- | |
| Hatzidakis Spyridon | $96,000 | -- | |
| Thompson Linda | $52,500 | -- | |
| Levesque Randall | $52,000 | -- |
Source: Public Records
Mortgage History
| Date | Status | Borrower | Loan Amount |
|---|---|---|---|
| Open | Levesque Randall | $82,850 | |
| Closed | Levesque Randall | $80,700 | |
| Previous Owner | Levesque Randall | $95,400 | |
| Previous Owner | Levesque Randall | $76,800 |
Source: Public Records
Tax History
| Year | Tax Paid | Tax Assessment Tax Assessment Total Assessment is a certain percentage of the fair market value that is determined by local assessors to be the total taxable value of land and additions on the property. | Land | Improvement |
|---|---|---|---|---|
| 2025 | $2,334 | $82,040 | $0 | $82,040 |
| 2024 | $2,487 | $82,040 | $0 | $82,040 |
| 2023 | $1,700 | $50,610 | $0 | $50,610 |
| 2022 | $1,684 | $50,610 | $0 | $50,610 |
| 2021 | $1,684 | $50,610 | $0 | $50,610 |
| 2020 | $1,676 | $50,610 | $0 | $50,610 |
| 2019 | $1,639 | $50,610 | $0 | $50,610 |
| 2018 | $1,578 | $47,880 | $0 | $47,880 |
| 2017 | $1,547 | $47,670 | $0 | $47,670 |
| 2016 | $1,503 | $47,670 | $0 | $47,670 |
| 2015 | $1,474 | $47,670 | $0 | $47,670 |
| 2014 | $1,453 | $47,670 | $0 | $47,670 |
Source: Public Records
Map
Nearby Homes
- 943 High Path Rd Unit 943
- 268 High Path Rd Unit 268
- 136 High Path Rd
- 98 High Path Rd
- 106 Rockybrook
- 246 Kenswick Ln Unit 246
- 105 Sunrise Cir
- 22 Eastview Dr
- 1 Deanne Lynn Cir
- 957 Palisado Ave
- 35 Hollow Brook Rd
- 309 S Elm St
- 490 Old Day Hill Rd
- 24 Mary Catherine Cir
- 58 Hollow Brook Rd
- 24 MacKtown Rd
- 22 Settler Cir
- 32 Gantley Rd
- 625 Palisado Ave Unit 313
- 1333 Palisado Ave
- 303 High Path Rd
- 299 High Path Rd
- 301 High Path Rd
- 301 High Path Rd
- 301 High Path Rd Unit 301
- 297 High Path Rd
- 311 High Path Rd Unit 311
- 293 High Path Rd
- 293 High Path Rd Unit 293
- 295 High Path Rd
- 295 High Path Rd Unit 295
- 313 High Path Rd
- 313 High Path Rd Unit 313
- 315 High Path Rd
- 315 High Path Rd Unit 315
- 291 High Path Rd
- 289 High Path Rd
- 223 High Path Rd
- 223 High Path Rd Unit 223
- 221 High Path Rd
Your Personal Tour Guide
Ask me questions while you tour the home.